Values and formats
A field in Values fills the table's cells: summed, counted or averaged per row and column. Its menu (the arrow on the chip) changes how it is computed, shows it as a share or a running total, formats the number and colours the cells. A report can hold several values side by side, also the same field twice (the sum and the average of a cost, say).
The menu of a value
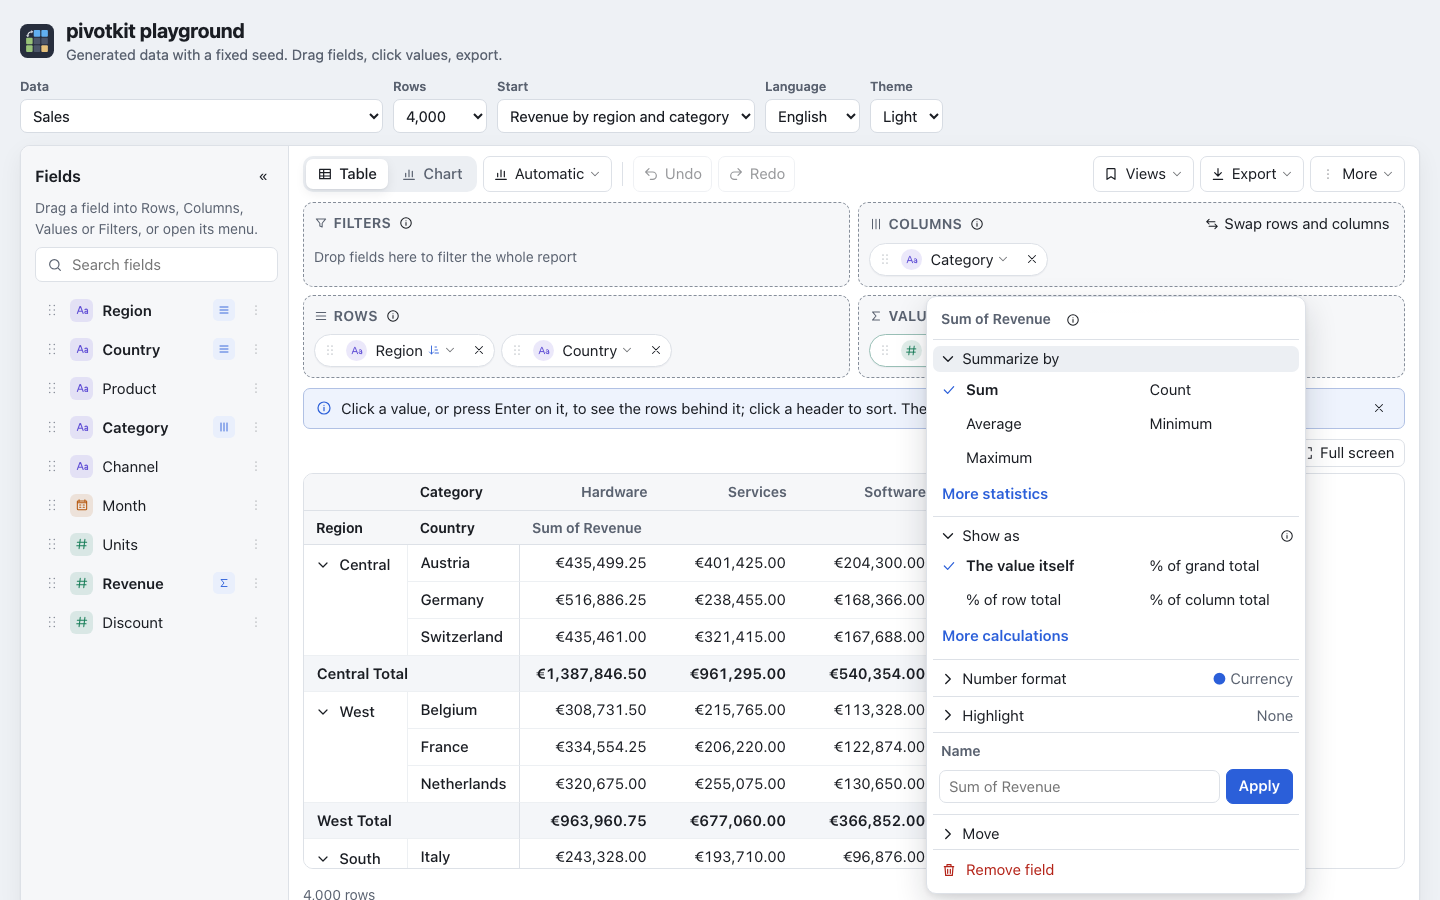
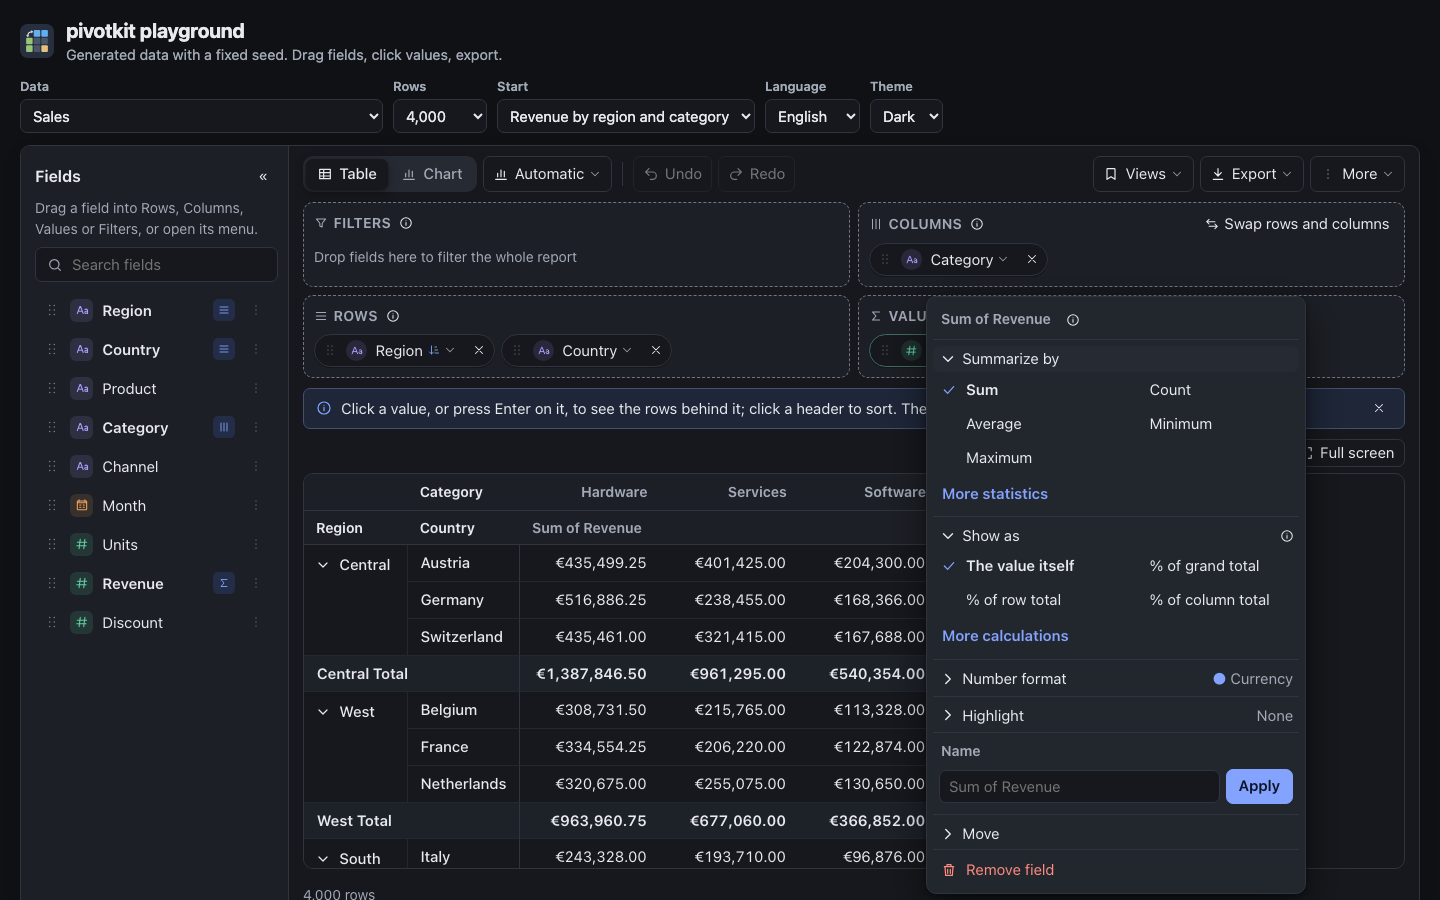
| Section | What it offers |
|---|---|
| Summarize by (open; the i at its end) | Sum, count, average, minimum, maximum; the statistics (median, distinct count, standard deviation, variance, first, last) under More statistics (below). |
| Show as (open) | The value itself, % of grand total, % of row total, % of column total; differences, running totals and ranks under More calculations. |
| Number format (folded) | Automatic, number (also with no or two decimals), currency, percent; whole number, compact (1.2K), bytes and durations from hours or seconds under More formats. |
| Highlight (folded) | None, a colour scale or data bars, in the theme's colours. |
| Name | Type a name and Apply. |
| Move (folded) | To another zone. |
Folded sections open with their title and say what they hold while folded ("Number format · Automatic"); a dot marks one that is not at its default (long menus). The menu's first row is the value's name with an i: it holds the field's description, when the application gives one (with Learn more when there is a page about it), and, while Show explanations is on, a paragraph that says values are not filtered here: filter a field on Rows or Columns through its menu, or move a field to Filters. With neither, the row is not there.
Summarize by
| Entry | Computes | Fits |
|---|---|---|
| Sum | Adds up | numbers |
| Count | Rows with a value in the field | every field |
| Average, Median | The mean, the middle value | numbers, dates |
| Minimum, Maximum | The smallest, the largest | numbers, dates |
| Distinct count | Distinct values | every field |
| List of distinct values | The distinct values as text | every field |
| Standard deviation, Variance (sample or population) | The spread of the numbers | numbers |
| First value, Last value | The value of the first or last row in the data's order | every field |
Sum, Count, Average, Minimum and Maximum come first; the others are under More statistics.
- A value is named after how it is summarized and its field ("Sum of Revenue") until you give it a name.
- Blank values are skipped. A cell with rows but no numbers is 0 for a sum and empty for an average,
a median, a minimum, a maximum or a variance (Excel shows
#DIV/0!or 0 there). - Picking another entry drops "Show as" and keeps the number format while the result is in the field's unit (an average to a median: still hours); a count, a distinct count or a list starts with its own.
- The application may pick how a field is summarized when it is added (an average for a duration, say).
Show as
| Entry | Shows |
|---|---|
| % of grand total | The cell's share of the grand total. |
| % of row total | The cell's share of its row's total. |
| % of column total | The cell's share of its column's total. |
| % of parent row, % of parent column | The share of the group one level up. |
| Difference from previous, % difference from previous | Minus the previous item, as a number or a percentage. |
| Running total, % running total | Adds up item by item, as a number or as a share of the total. |
| Rank, smallest first; Rank, largest first | 1 for the smallest, or for the largest. |
- The header then says it: "% of grand total of Revenue".
- Differences, running totals and ranks walk along Rows or Columns within each group: the Along switch (Rows or Columns) sets the direction. An i next to Show as and next to Along explains them.
- A running total needs a value that adds up (a sum or a count); on an average or a median it is refused, since a running "total" of averages means nothing. A saved view or a link that asks for one shows the plain value instead, and the report says so above the result: "this “Show as” needs a sum or a count, not Average - the plain value is shown" (details).
Number format
| Entry | Example |
|---|---|
| Automatic | the same decimals in every cell of the column (see below) |
| Number; Number, no decimals; Number, 2 decimals | 1,234.5 · 1,235 · 1,234.50 |
| Currency | €1,234.50 |
| Percent | 25% |
| Whole number | 1,235 |
| Compact (1.2K) | 1.2K |
| Bytes (KB, MB) | 1.5 MB |
| Duration from hours, Duration from seconds | 2 h 5 min |
Whole number, Compact, Bytes and the durations are under More formats.
- Automatic gives every cell of a column the same decimals: those of the data (at most 2) for a
sum, minimum, maximum, first or last; 2 for an average, a median or a spread; none for a count; one
for a percentage. So a sum of fractions keeps two decimals also where it adds up to a whole number
("118.00" next to "2.33"): the column lines up, as Excel's
0.00does. - A format a saved view brought along that is not in this list (a date, text, another currency, other decimals) stays until you pick another; no entry is checked then.
- Numbers, dates and currency follow the report's language, never the computer's.
Show as, format and highlight only for numbers
Show as, Number format and Highlight are there only for a value that gives a number in every cell: not for a list of distinct values, the first or last entry of a text, or the average, median, minimum or maximum of dates. Such a value keeps Summarize by, Name and Move.
Highlight
- Colour scale: each cell coloured from low to high.
- Data bars: a bar in each cell, its length the cell's place between the smallest and the largest cell of that value.
Totals are not highlighted. The Excel export keeps both as Excel's own conditional formats.
Name
Type a name and Apply. The × gives the value its default name back at once ("Sum of Revenue", shown as the placeholder), as one step Undo takes back.
Dates and number ranges
A date on Rows or Columns is grouped as soon as it is placed, by the span of its values: up to 62 days by day, up to two years by month, up to six years by quarter, longer by year. The chip names the grouping in words: "Created by month", in German "Erstellt nach Monat". Its menu, Group dates by, changes the unit.
| Along the time line | Label | Compare periods across years | Label |
|---|---|---|---|
| Year | 2025 | Quarter of year | Q1 |
| Quarter | Q1 2025 | Month of year | Jan |
| Month | Jan 2025 | Week of year | W03 |
| Week | 2025-W03 | Weekday | Mon to Sun (Monday first) |
| Day | Jan 15, 2025 | Hour of day | 00:00 to 23:00 |
No grouping (every date and time) takes the grouping off. Along the time line each item is one period; across years an item repeats every year (or every day), for comparing periods. Labels follow the report's language; the "Q" of quarters and the "W" of weeks are the same in every language.
Number ranges
Group into ranges… in the menu of a number field on Rows or Columns (section Number ranges) opens a form: the size of the ranges and where they start, Starting at, then Apply. The chip then reads "Amount (by 100)", and the menu says it in one line, "Ranges of 100 from 0", with Change (the form again, filled in) and Remove.
- A range includes its lower bound and excludes the upper one.
- A new size keeps the start; an empty start is 0. The × of Starting at empties it.
- Remove, or Apply with no size, takes the ranges away again (one step Undo takes back). Cancel closes the form without a change.
- A start so far from the field's numbers that every row would be blank is refused with a note under it.
- Range labels use the language's thousands separators ("10,000 – 20,000"), except when every range has whole-number bounds between -9,999 and 9,999: ranges of years, ages or scores read "1900 – 1910".
- Numbers are typed as your language writes them ("1.000,5" in German); a plain "1000.5" works in every language (numbers in menus).
For developers
The view's keys for values (agg, showAs, format, conditional, label), every format a view
may name, and how they reach Excel and CSV are in
Values: aggregators, show as, formats; date units, ranges and time zones
in Dates and number ranges. fieldDefaults sets what a field gets when it
is added (React props).