Charts
Chart in the toolbar draws the same report as a chart; Table brings the table back. The items of Rows are the categories along the axis, and each item of Columns and each value is a series. The button next to Table and Chart picks the type and has the Display settings: value labels, legend, title and more.
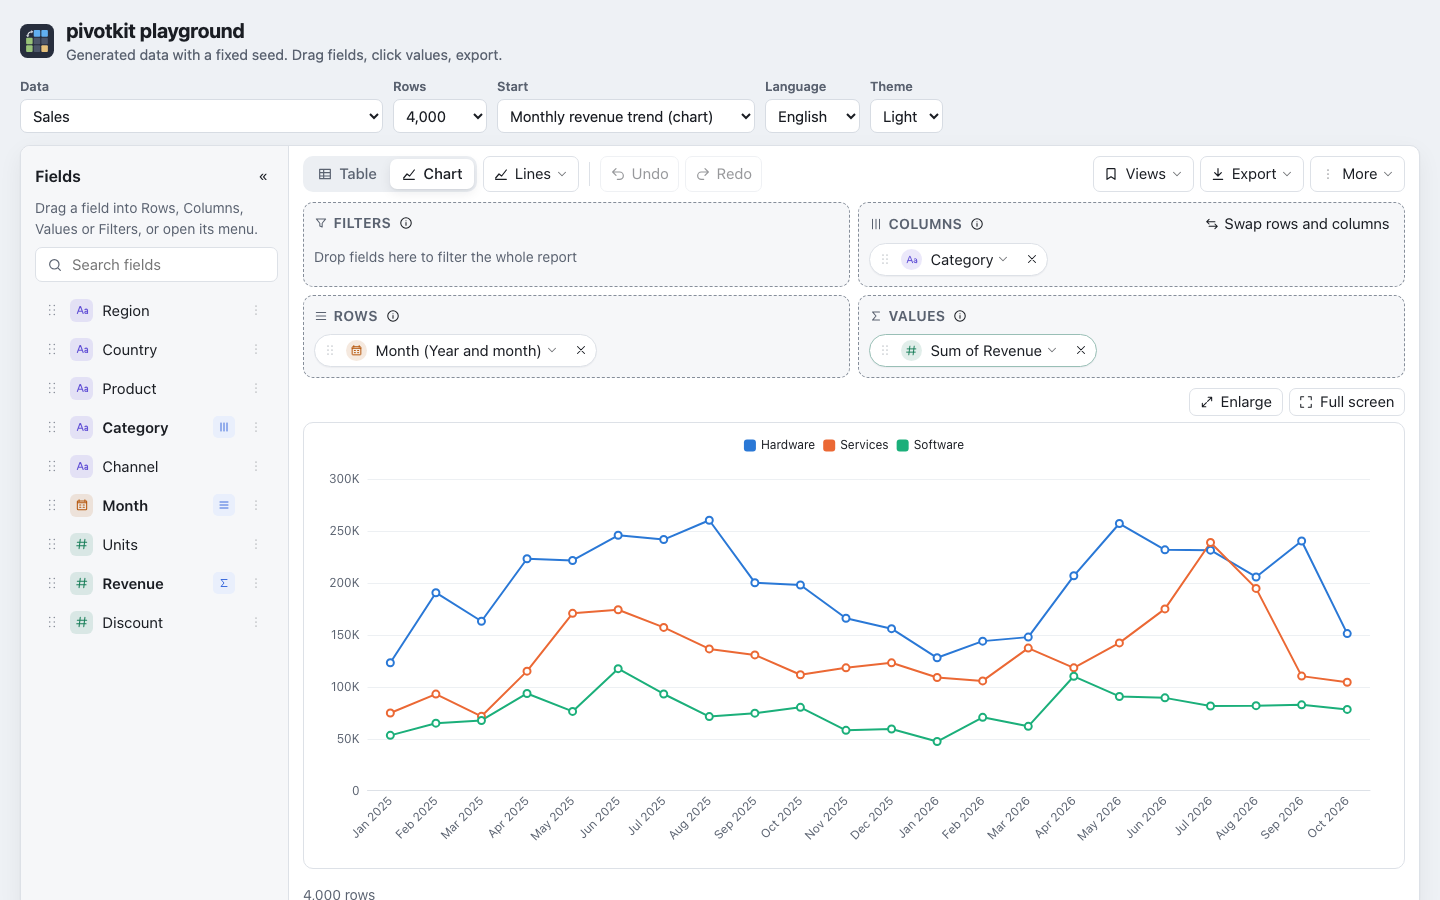
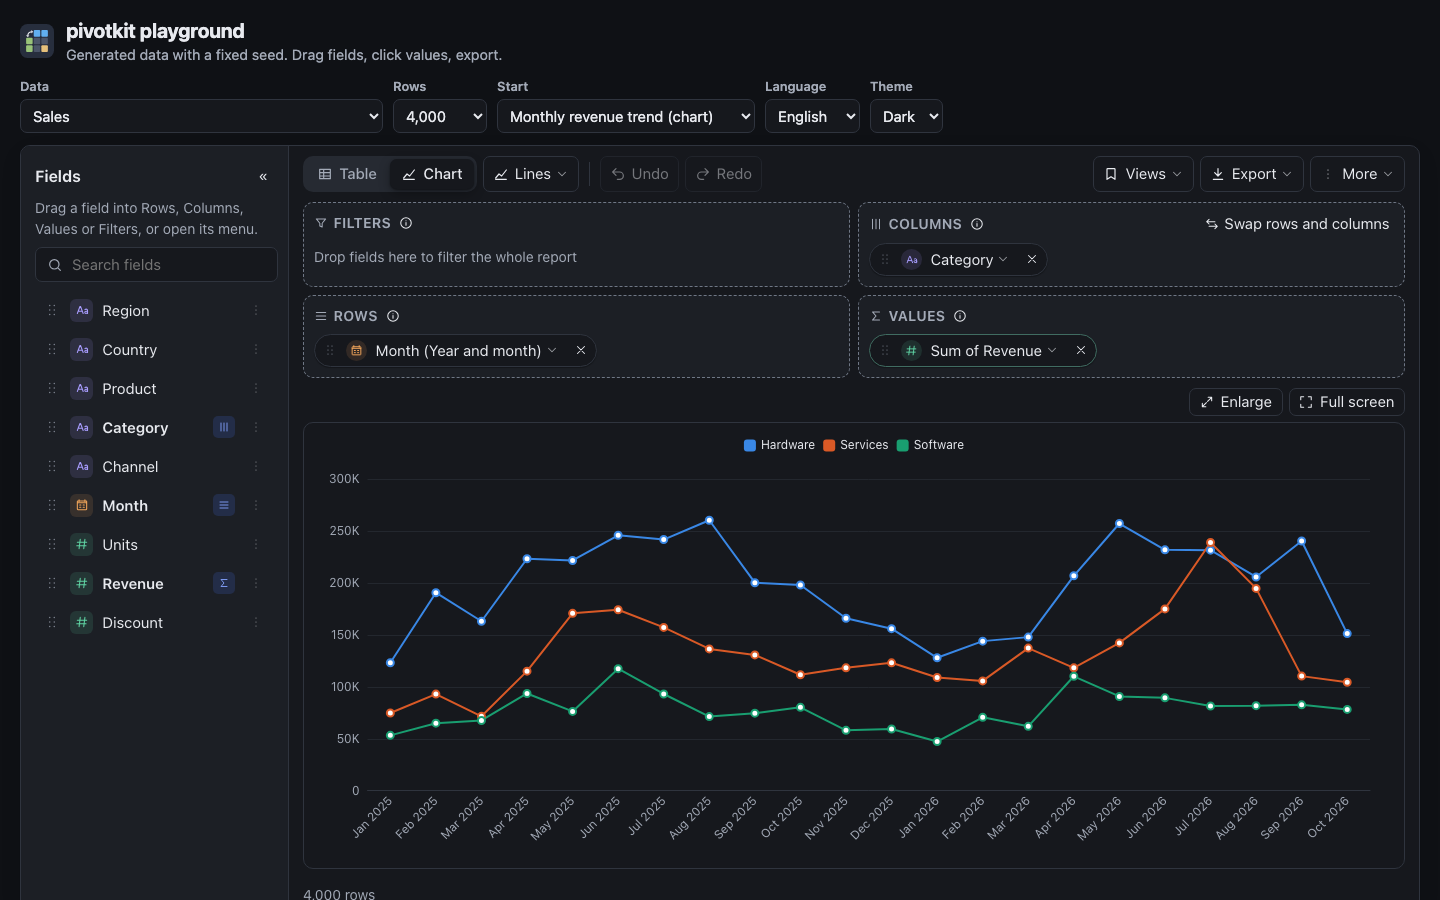
Chart types
| Type | Draws |
|---|---|
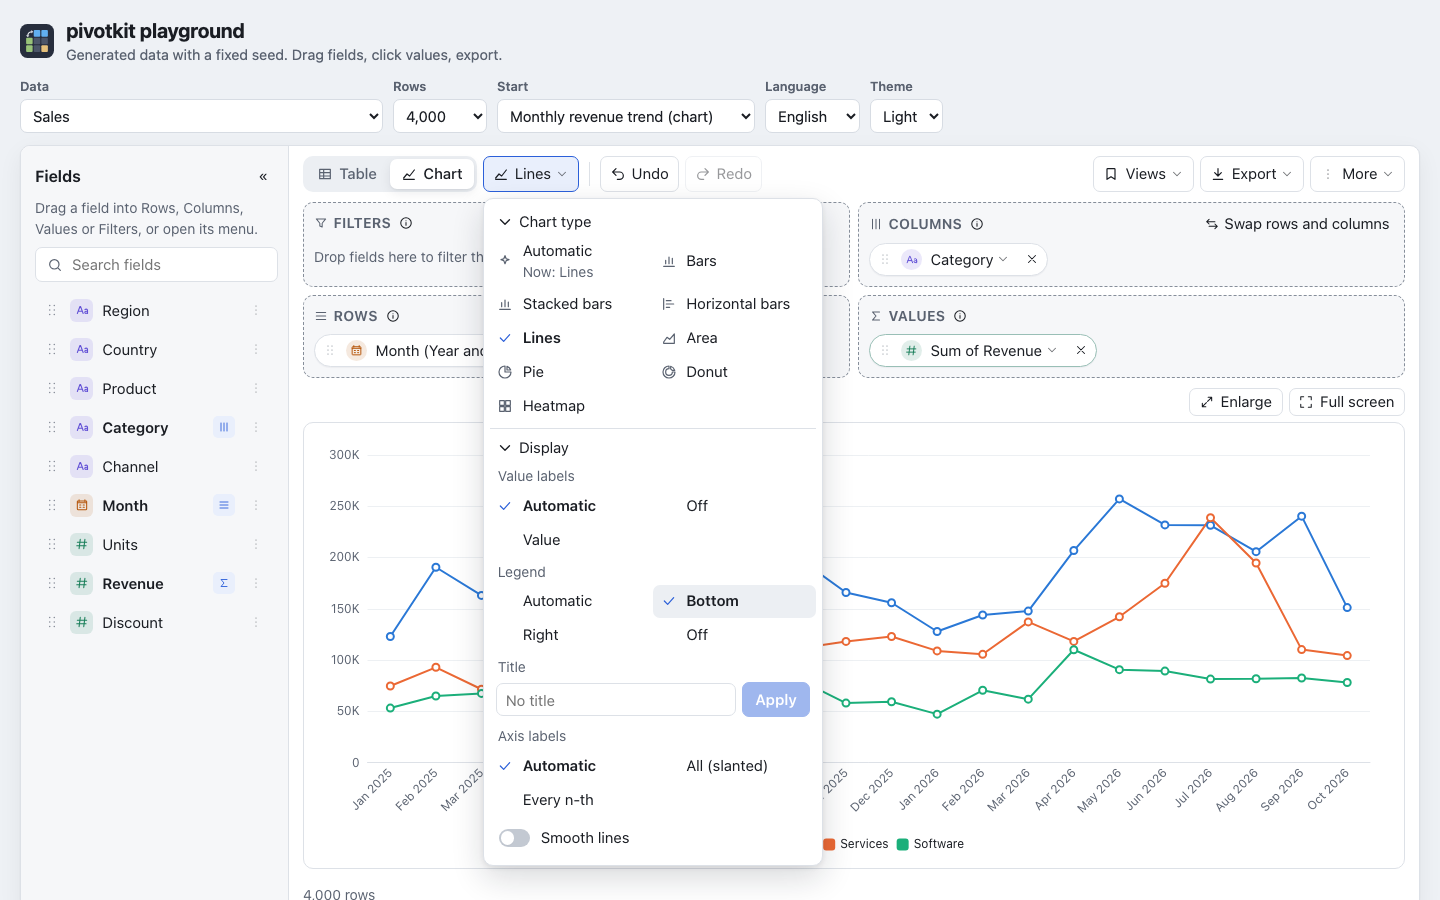
| Automatic | What fits the data (below); the default until you pick a type. |
| Bars, stacked bars, horizontal bars | A bar per category and series. |
| Lines, area | A line (filled below for area) per series. |
| Pie | A whole circle, one slice per row. |
| Donut | A ring, one slice per row. |
| Heatmap | A grid of rows and columns, coloured by value. |
Automatic decides by the data:
- A date, or a grouping of one along the time line ("Created by month": day, week, month, quarter, year), on Rows: lines, the dates along the axis. A grouping that repeats (weekday, hour of day, month, quarter or week of year) is categories: bars.
- Dates on Columns only: lines too, with rows and columns swapped for the chart alone, so the dates run along the axis and each item of Rows is a line; the table keeps its layout and the view is not changed. A click on a point opens its rows as in the table.
- Anything else: bars.
The type button shows the type ("Automatic", "Bars"; for a screen reader "Chart type: Bars"), and "Automatic" in its menu says what it draws now ("Now: Lines"). A type you pick stays.
Tips the chart gives
| When | The tip |
|---|---|
| You picked a type that is not lines over dates (bars, a pie) and the chart is over dates | Show as lines over time: back to Automatic, in one step Undo takes back. |
| A pie or a donut has more than about 7 slices | Switch to Bars. |
| A pie has a field on Columns | It adds the columns up into one slice per row. |
| Lines or an area over categories without an order (countries, teams) | "Lines connect points into a trend. For categories such as countries, bars fit better." with Switch to Bars. Not for dates, number ranges or a custom order (the seasons), and not when the dates are on Columns (that tip offers to swap). |
| More than 8 series, or lines with the dates on Columns | Swap rows and columns (also above the Columns zone). |
| More than 50 categories | At most 50 are drawn, with a note that always shows. |
Display settings
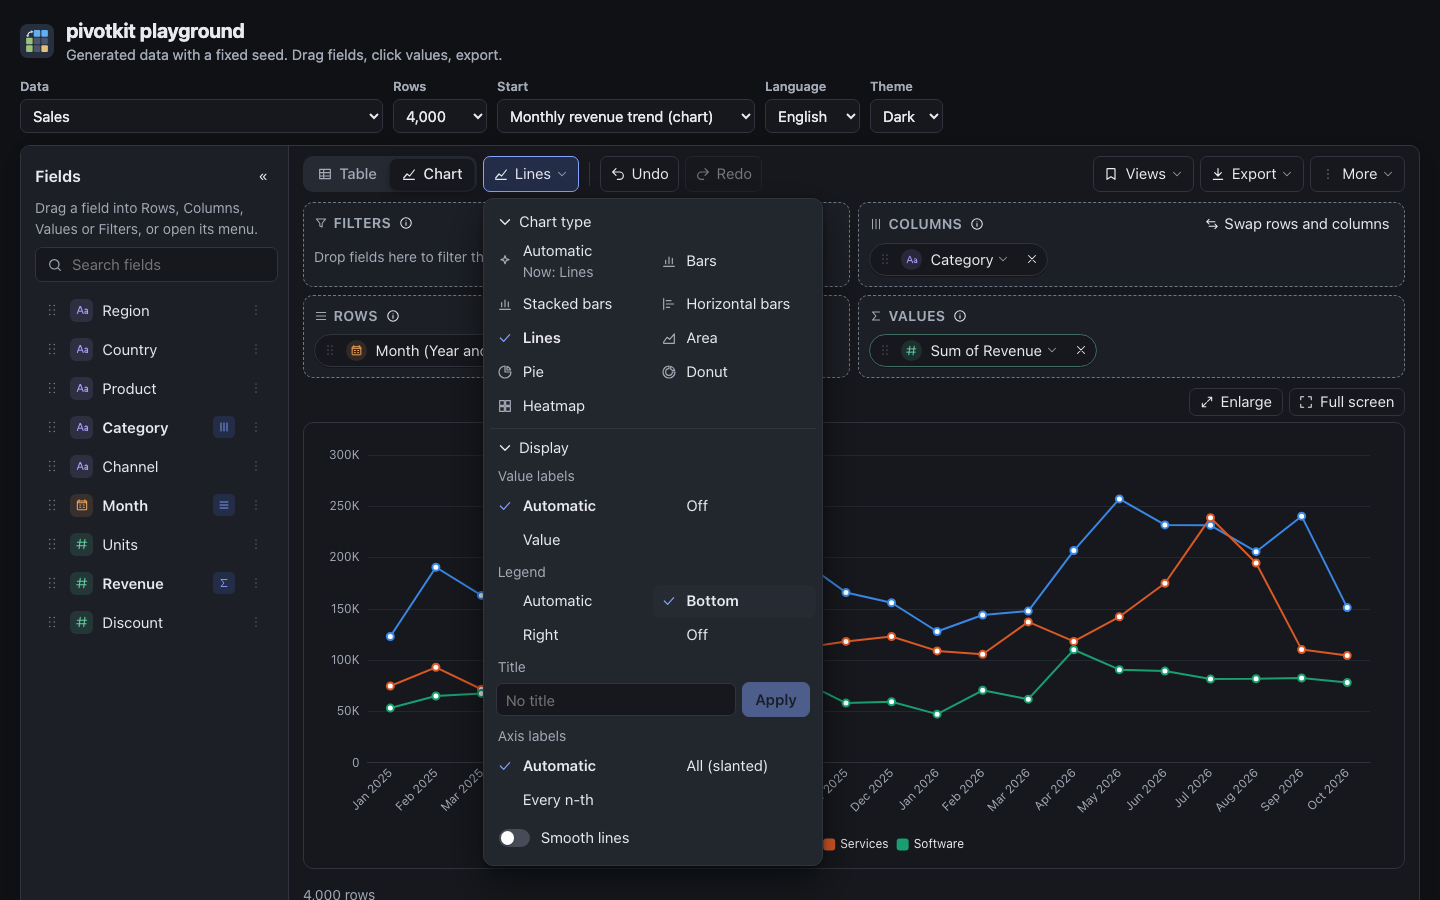
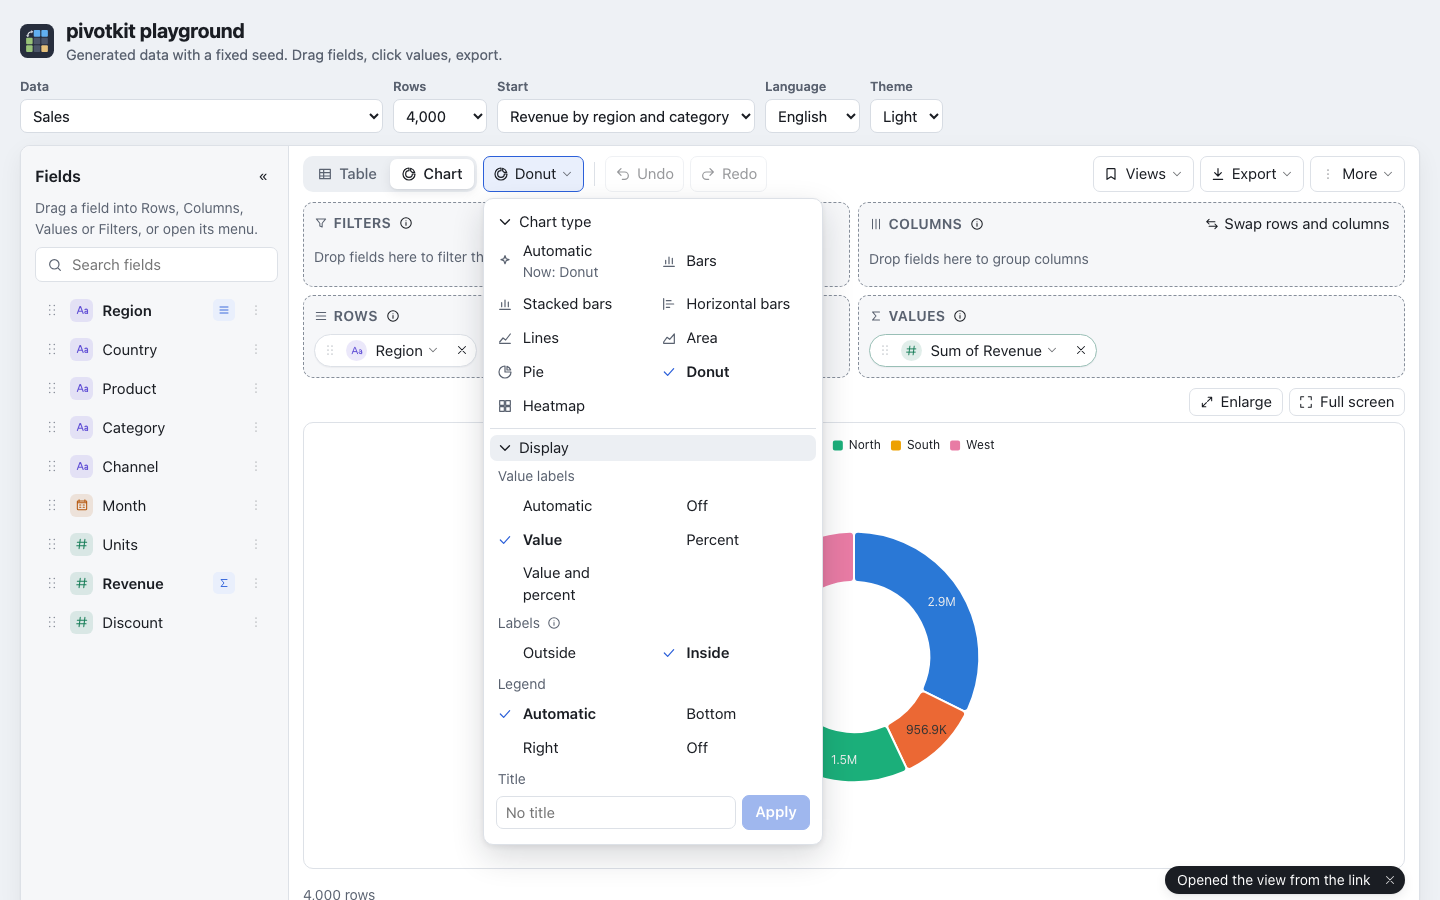
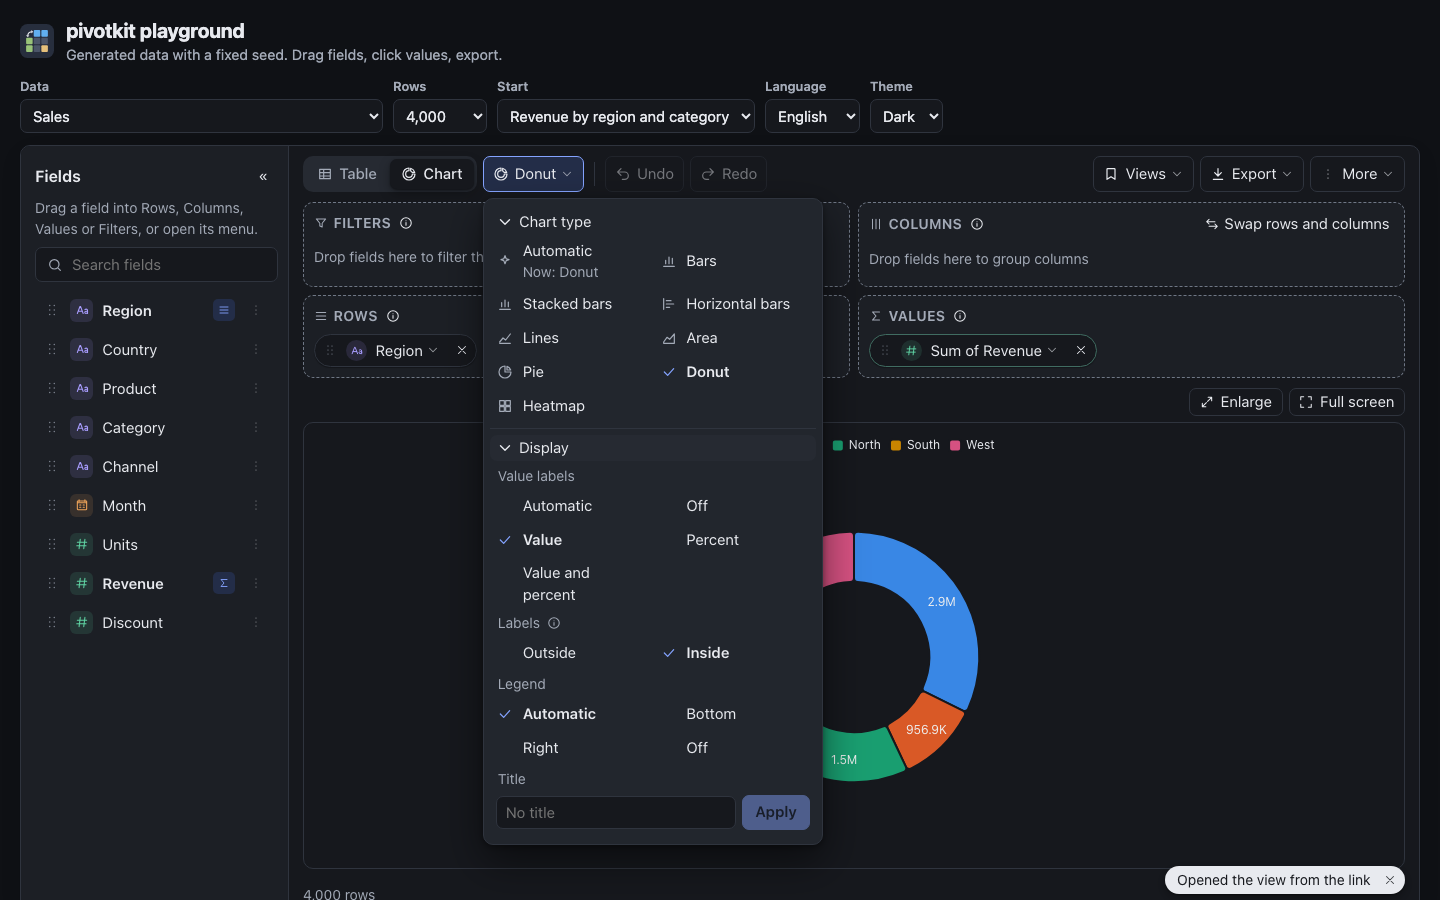
The chart type menu has a Display section under the chart types, folded at first: its title says which settings differ from the start ("Legend, Title", else "Automatic"); a click opens it and the report remembers that (long menus). Each choice applies at once and the menu stays open, so the chart behind it shows the change. The settings stay with the report: in saved views, links and the chart image, also when the chart type changes. An i next to Labels and to Group labels explains them.
| Setting | Choices | Default |
|---|---|---|
| Value labels | Automatic, Off, Value; for a pie and a donut also Percent and Value and percent | Automatic: a pie names its slices, a heatmap writes the numbers while there are 200 cells or fewer, bars and lines write nothing |
| Labels (pie and donut) | Outside, Inside; not offered while value labels are Off | Outside |
| Legend | Automatic, Bottom, Right, Off | Automatic: above the chart when there is more than one series (a pie and a donut always) |
| Title | any text; the × removes it at once | none |
| Smooth lines | on, off (lines and area only) | off |
| Axis labels | Automatic, All (slanted), Every n-th (bars, lines and areas) | Automatic |
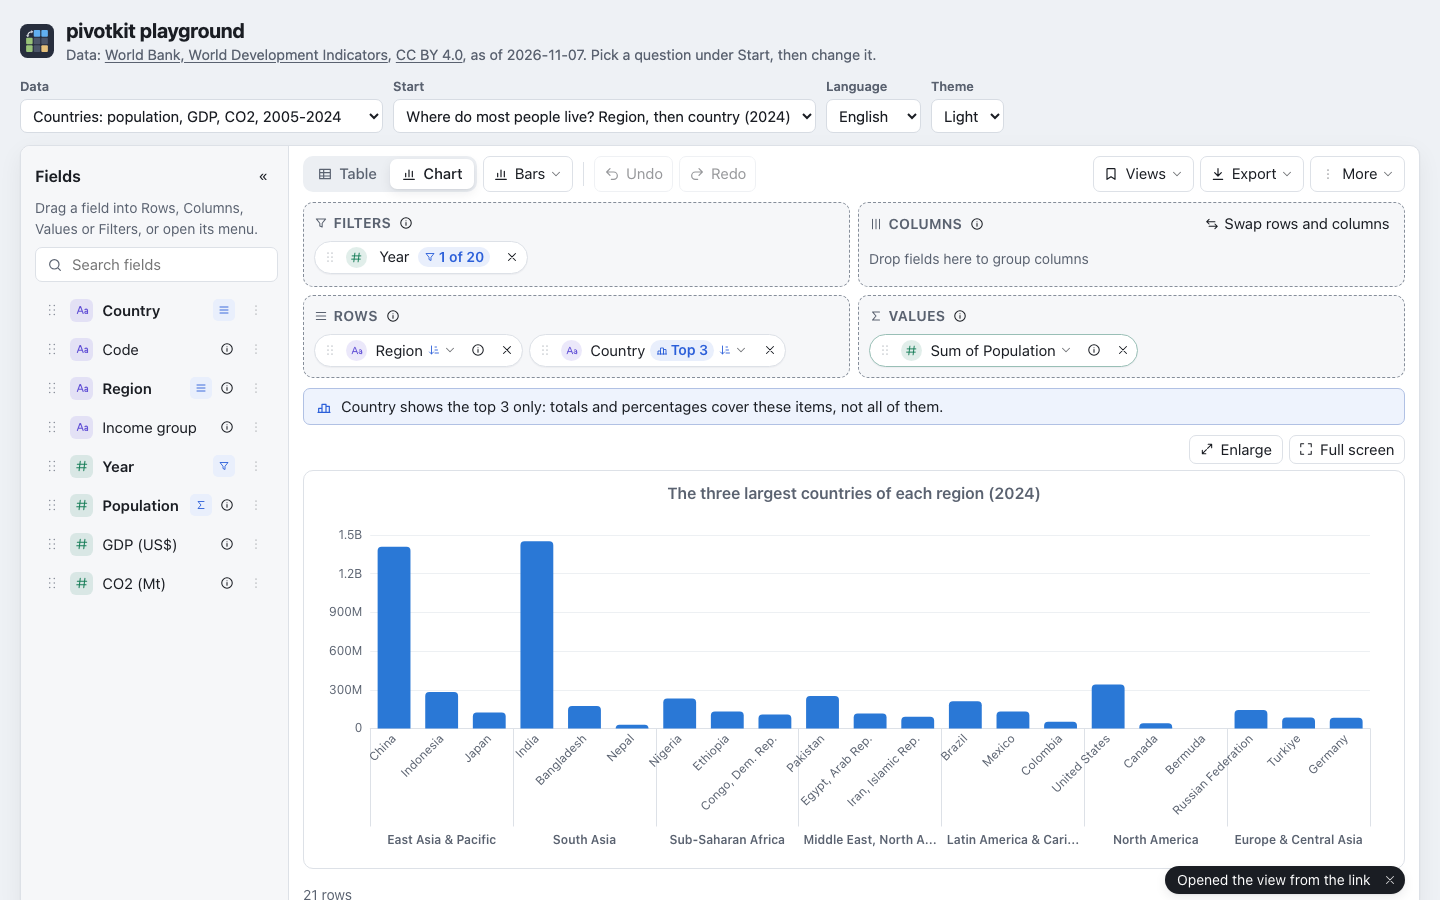
| Group labels under the axis | Automatic, On, Off (with two or more fields in Rows) | Automatic: shown while the chart has room for them |
Pie and donut labels
Outside writes each slice's name with what is chosen, on a line to the slice. Inside writes only the number on the slice (the share for Automatic), in a colour that reads on it; the legend names the slices, and a slice narrower than 12 degrees gets no label. When the ring of a donut is too thin for the numbers (a low or narrow chart), they are written outside, on a line to their slice. A pie's share is written as your language writes percentages ("35.7%", "35,7 %").
Legend and title
A legend on the Right of a chart narrower than 480 px (a phone) is drawn at the bottom, so the pie or the plot keeps its width. A title wider than the chart ends in "…", on screen and in the chart image; the chart's name for screen readers includes the title ("Chart: Revenue by region").
Axis labels
Automatic writes every category straight when the longest name fits its place, slanted by 45 degrees when they would overlap, and every n-th one (slanted) when not even that fits; a line under the chart then says "One label in every 3 is shown". All (slanted) always writes every label; Every n-th keeps them straight and leaves out as many as needed. A name longer than 120 px ends in "…"; the tooltip has it whole. Horizontal bars write their names straight, every one while a line fits each bar.
Group labels
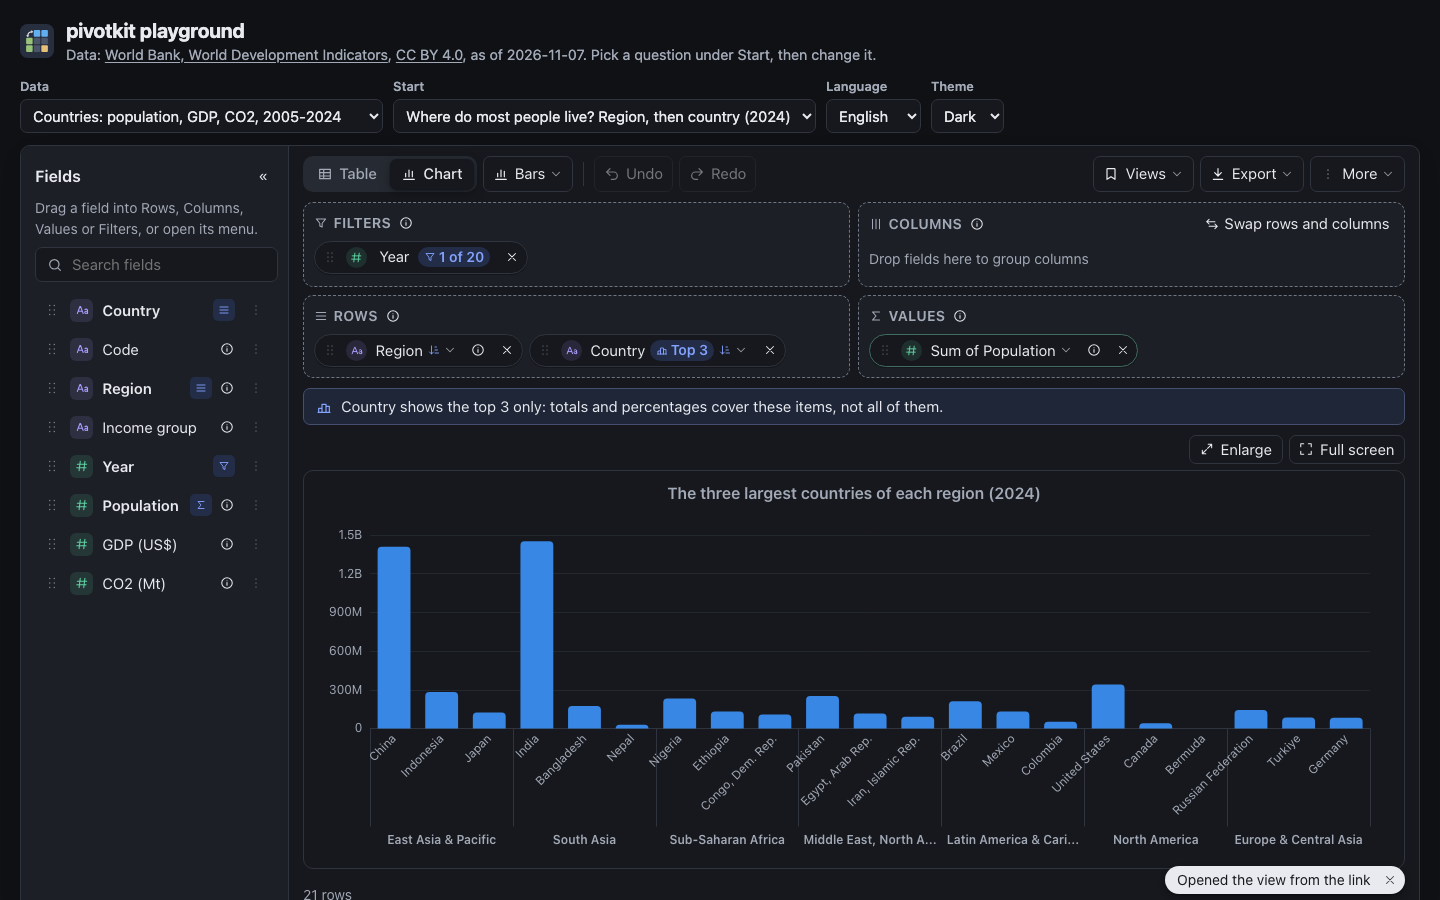
With two or more fields in Rows (Region, then Country) the axis names each category by its inner field (the country) and writes the outer field's item (the region) once under its categories, with a line between two groups. Horizontal bars put the groups left of the names. Off writes the whole path at each category ("Asia / Japan"). Automatic shows them only where they can be read: a chart at least 420 x 260 px, and at least 56 px under the axis for the smallest group (28 px beside it for horizontal bars); in a smaller chart, on a phone say, the axis writes the whole paths instead. On shows them always.
Read the chart
- Pointing at a category of bars, lines or areas shows a tooltip with its whole name and one line per series: the series' colour, its name and the value formatted as in the table. A pie shows the value's name, the slice and its value; a heatmap the value's name, the cell's row and column and its value. The tooltip is plain text: nothing from the data is read as markup.
- A heatmap's colour scale writes its ends in the value's number format.
- A click on a bar, a point or a heatmap cell opens the rows behind it, as in the table (the rows behind a number).
- The chart has a text alternative for screen readers: type, values, counts, highest and lowest value.
Save the chart as a picture
Export, Chart image (.png) saves the chart as it is drawn, at twice the screen's resolution, on the report's background colour: with its title, legend, value labels and group labels. It is greyed out while the table is shown ("Switch to Chart first.") (export).
For developers
The view's chart settings, what "auto" stands for (autoChartType) and chartOptions, plain
JSON merged over the ECharts option for what the menus do not offer, are in
Charts.