The rows behind a number
Click a value in the table or a mark in the chart, and a panel shows the rows of the data behind it: which tickets make up "648", which sales add up to a region's revenue. From there you can copy the rows or download them.
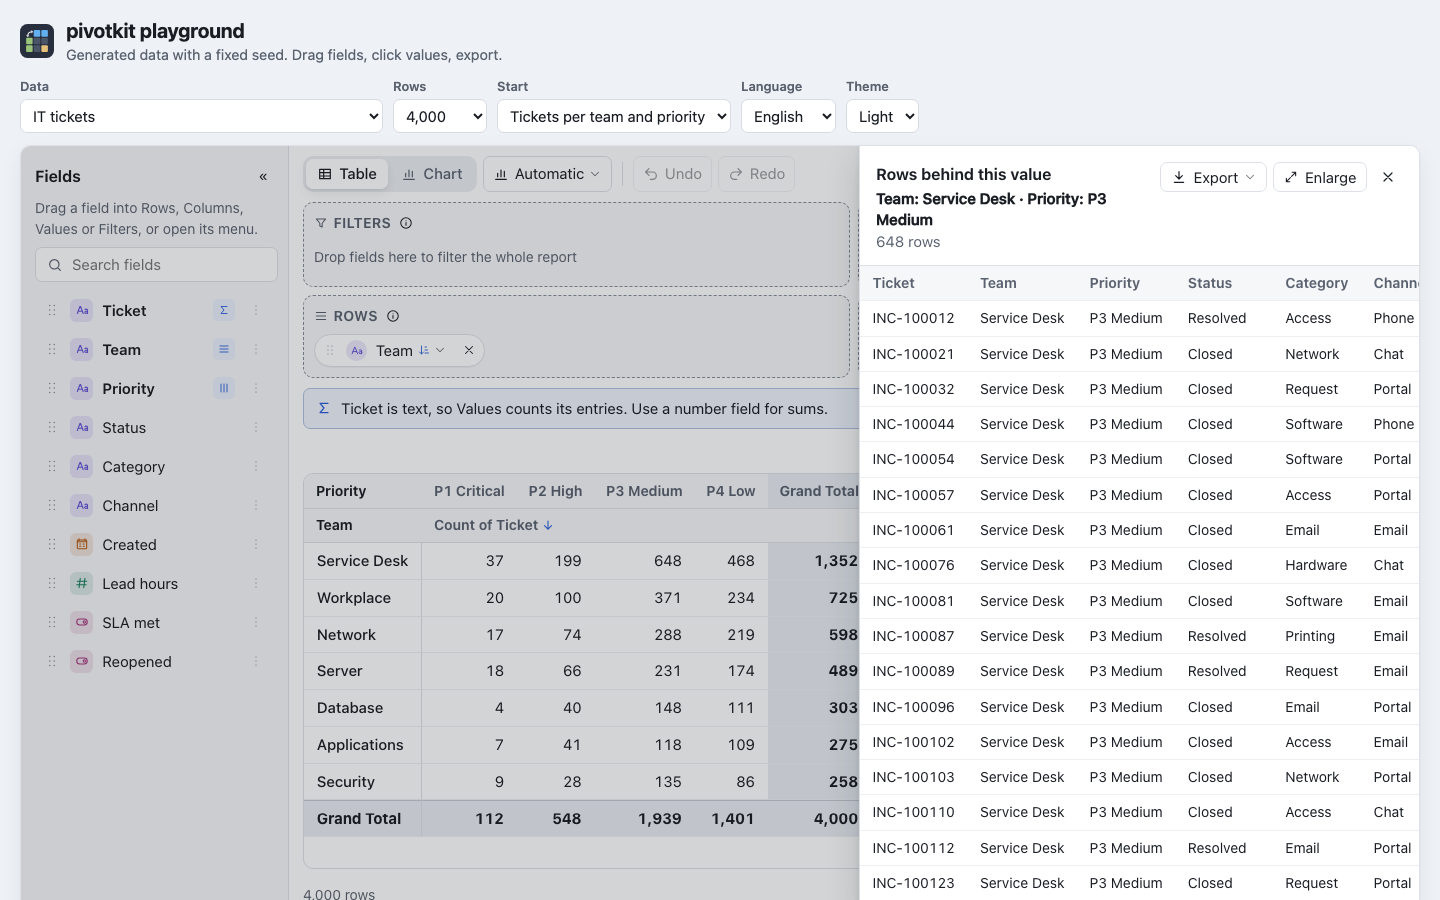
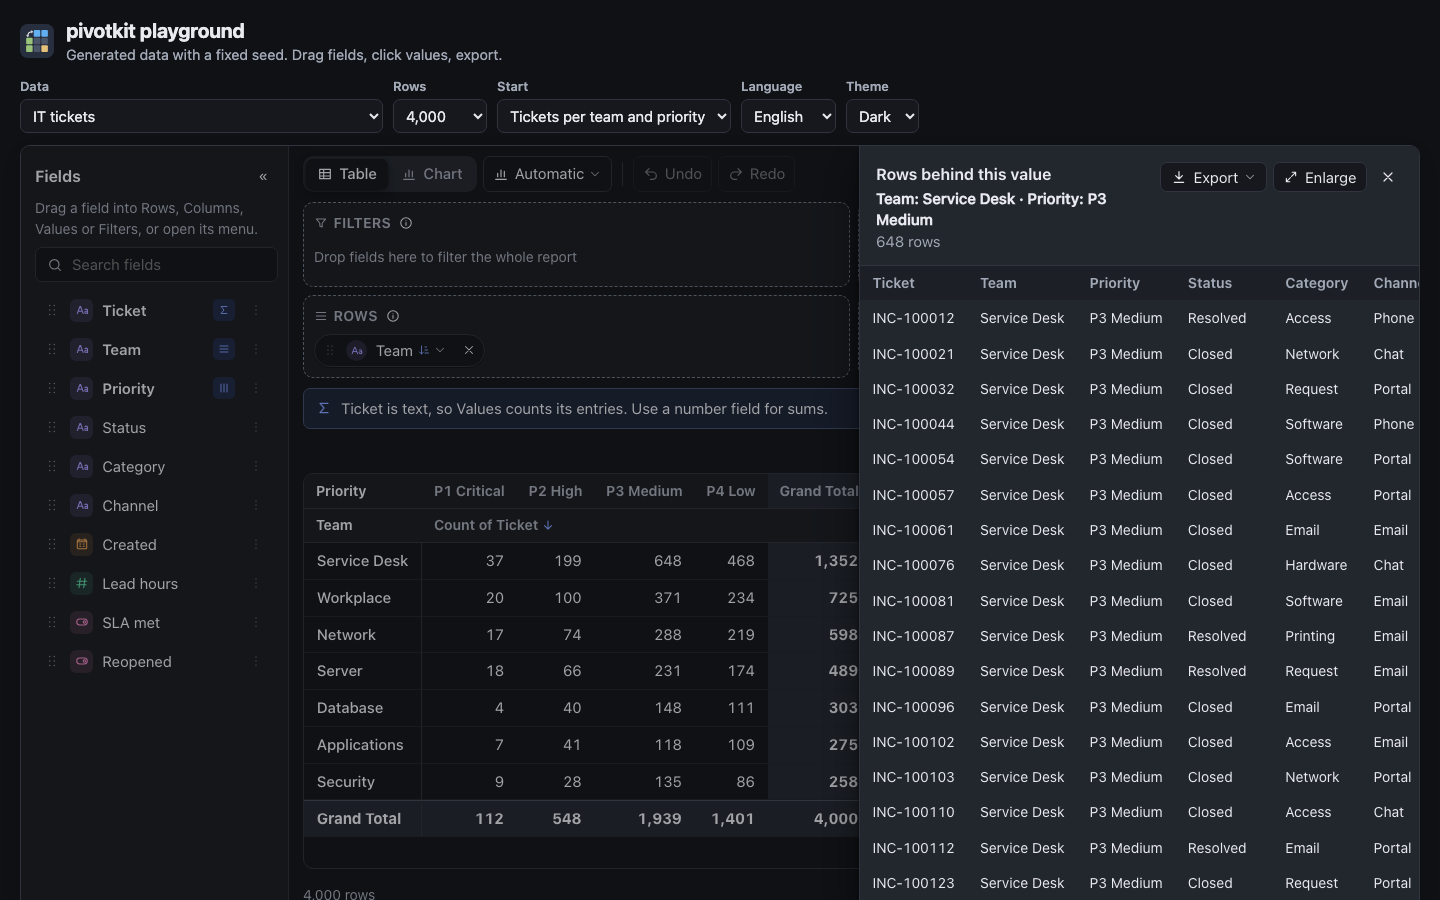
Open and close the panel
| To | Do |
|---|---|
| Open it | Click a value, or move to it with the arrow keys and press Enter or Space. In the chart, click a bar, a point or a heatmap cell. |
| Give it the whole report | Enlarge. Reduce or Escape brings it back to its size; the focus stays on the button. |
| Close it | Escape (a second Escape when it is enlarged), its close button, or a click beside it. The focus returns to the value. |
- The rows are formatted as the table formats them: dates as dates, numbers in your language, yes/no fields as "Yes" and "No".
- The panel covers the report while it is open: the focus stays in it.
- It lists up to 1,000 rows by default; with more behind the value its title line says "Showing the first 1,000 of 4,210 rows". The application can raise the limit.
- A blank cell with no rows behind it opens nothing.
- Each column is as wide as its content; a long text wraps inside its column, so the panel scrolls sideways less.
- On a narrow report the panel fills it already and has no Enlarge. Enlarge is not part of the saved view.
Copy or download the rows
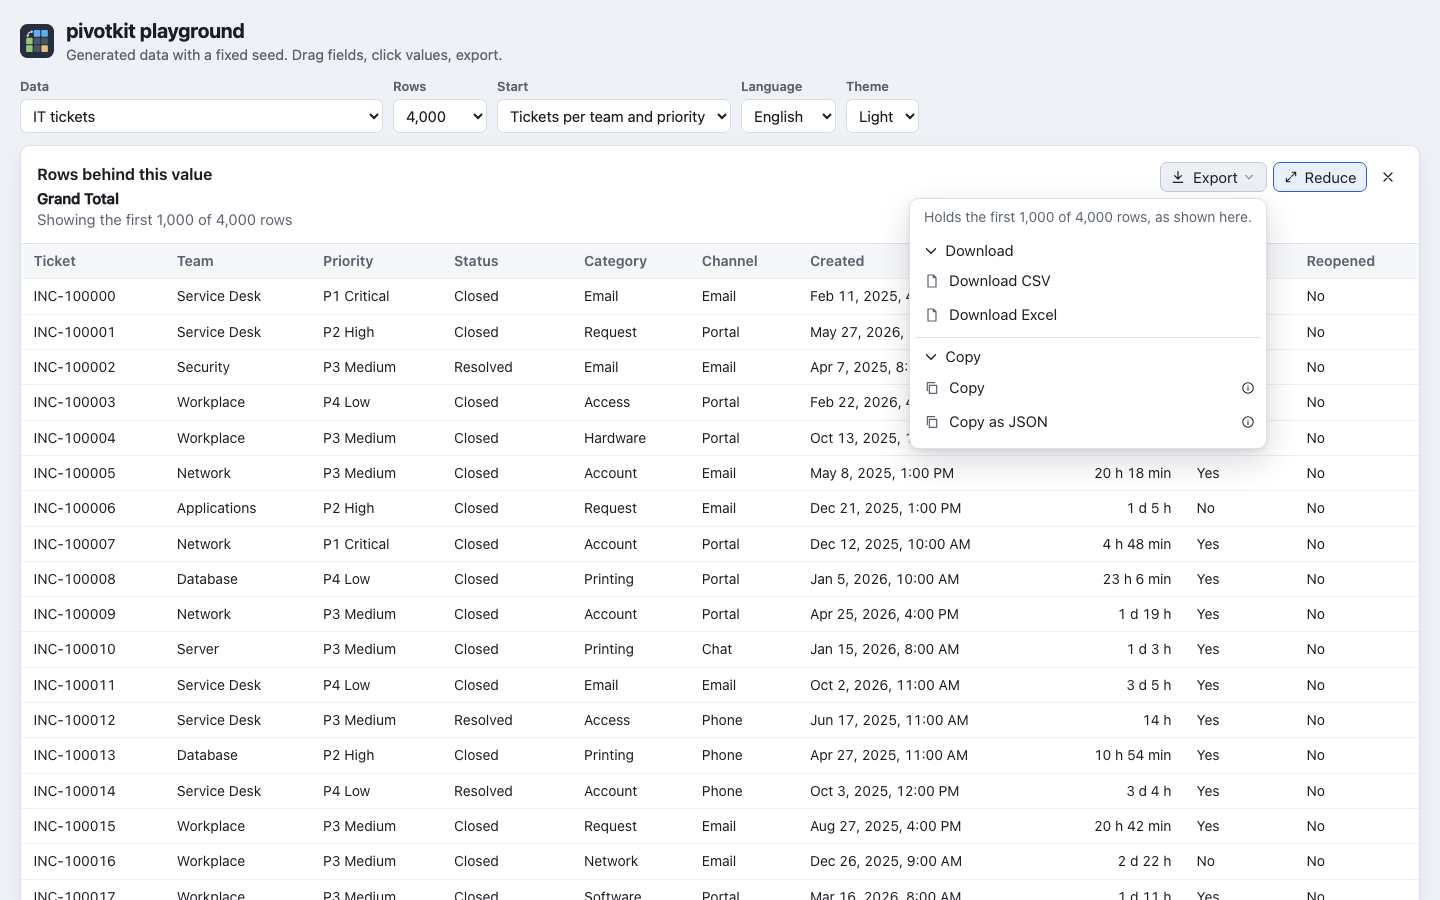
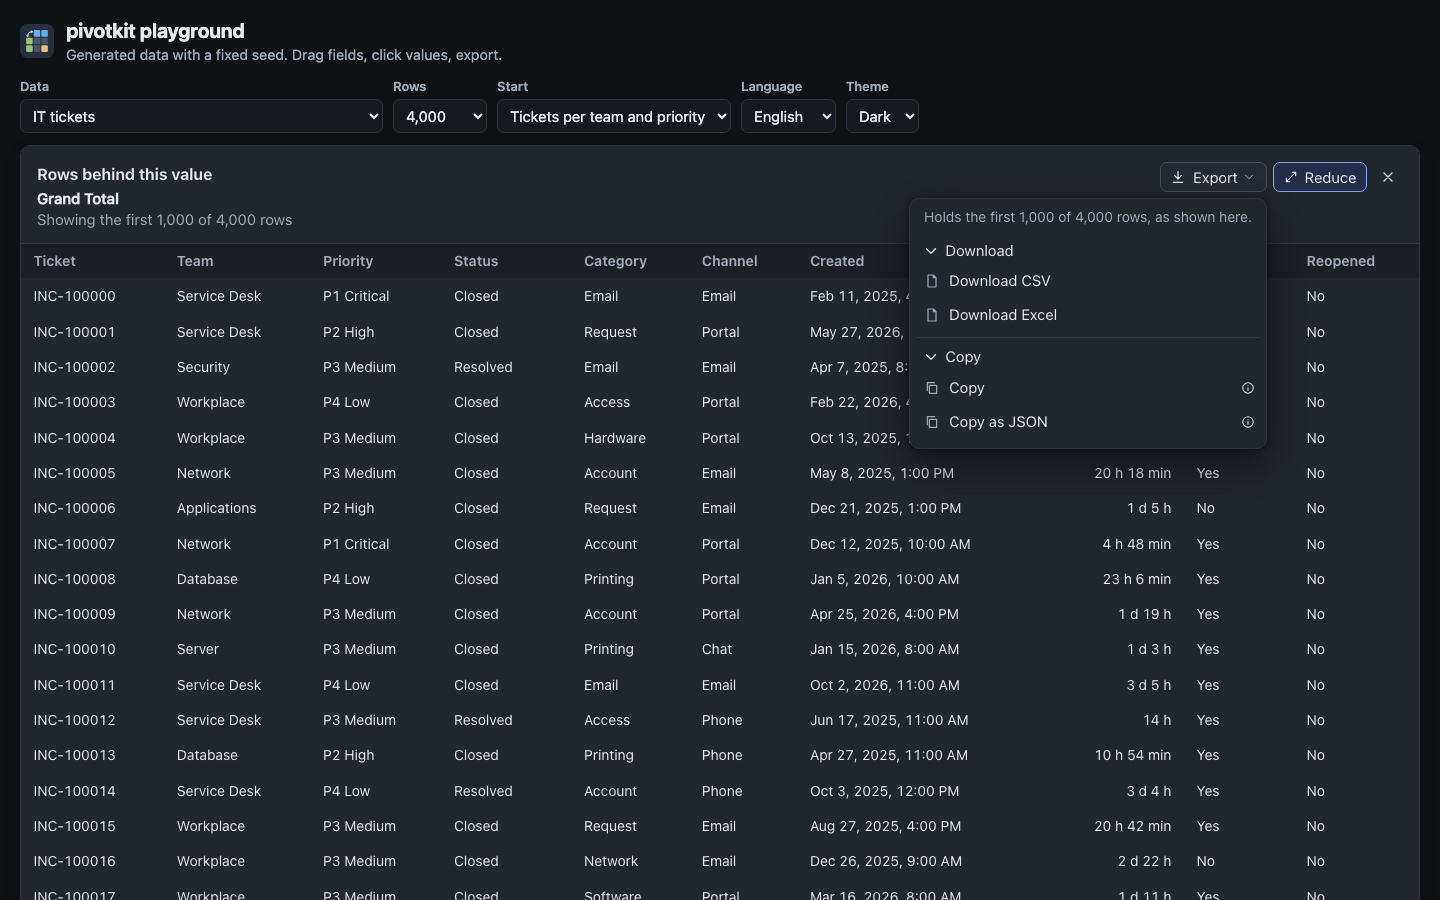
The panel's Export menu, in two sections, Copy and Download:
| Entry | Gives |
|---|---|
| Copy | The rows as the panel shows them (dates and numbers in your language), tab-separated with a header row. Pasted into Excel, Numbers or Google Sheets they land in columns, and a spreadsheet in the same language reads the numbers and dates back as numbers and dates. An i says so. |
| Copy as JSON | The rows as objects with the data's field names and raw values (numbers as numbers, dates as ISO dates, blank null), for a program. |
| Download CSV, Download Excel | The rows with the headers the panel shows, each value formatted as in the panel (a field's format, numbers with up to 6 decimals, dates as their day). The Excel file keeps numbers and dates as numbers and freezes the header row. |
- Files and sheet are named after the cell:
Central – Jul 2026.csv. - With more rows behind the value than the panel shows, every export holds the rows shown: the menu says "Holds the first 1,000 of 4,212 rows, as shown here.", and the note after a copy "Copied 1,000 of 4,212 rows".
- A copy says what it gave ("Copied 25 rows: …"); the notes show above the open panel.
- Text a spreadsheet would run as a formula gets a leading
', as in every export (security). - The sections fold like the other menus' sections, and the report remembers them.
For developers
drillDown turns the panel off, drillDownLimit sets how many rows it gets, onCellClick gives
the host the clicked cell and its rows, and fieldDefaults.drillFormat a field's format in the
panel; every copy and file passes onExport first (drill-copy, drill-json, drill-csv,
drill-xlsx). See the pivotkit-react reference.