Small screens, menus and tips
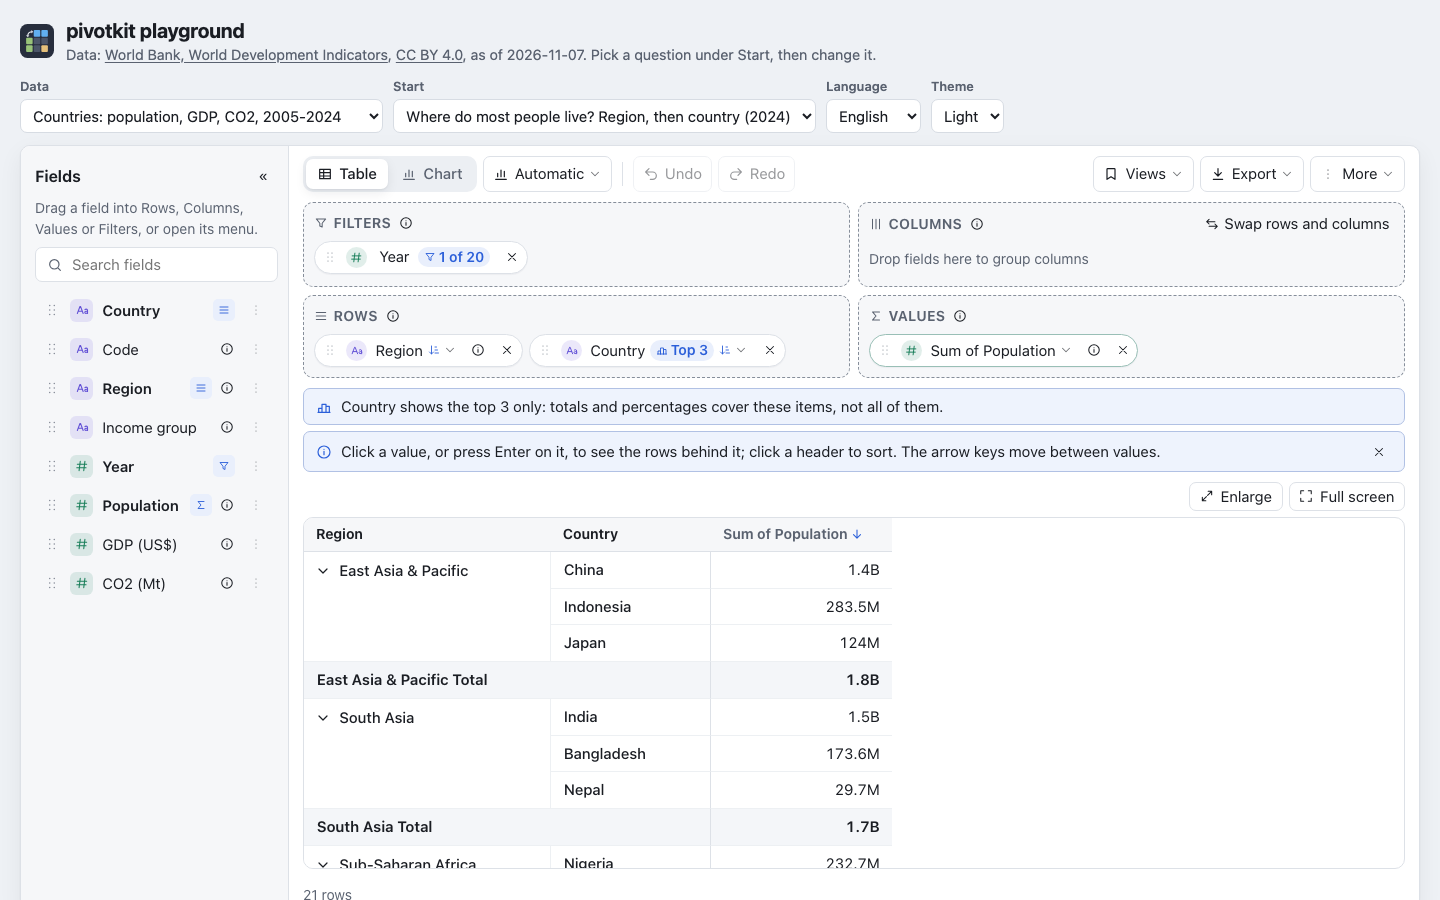
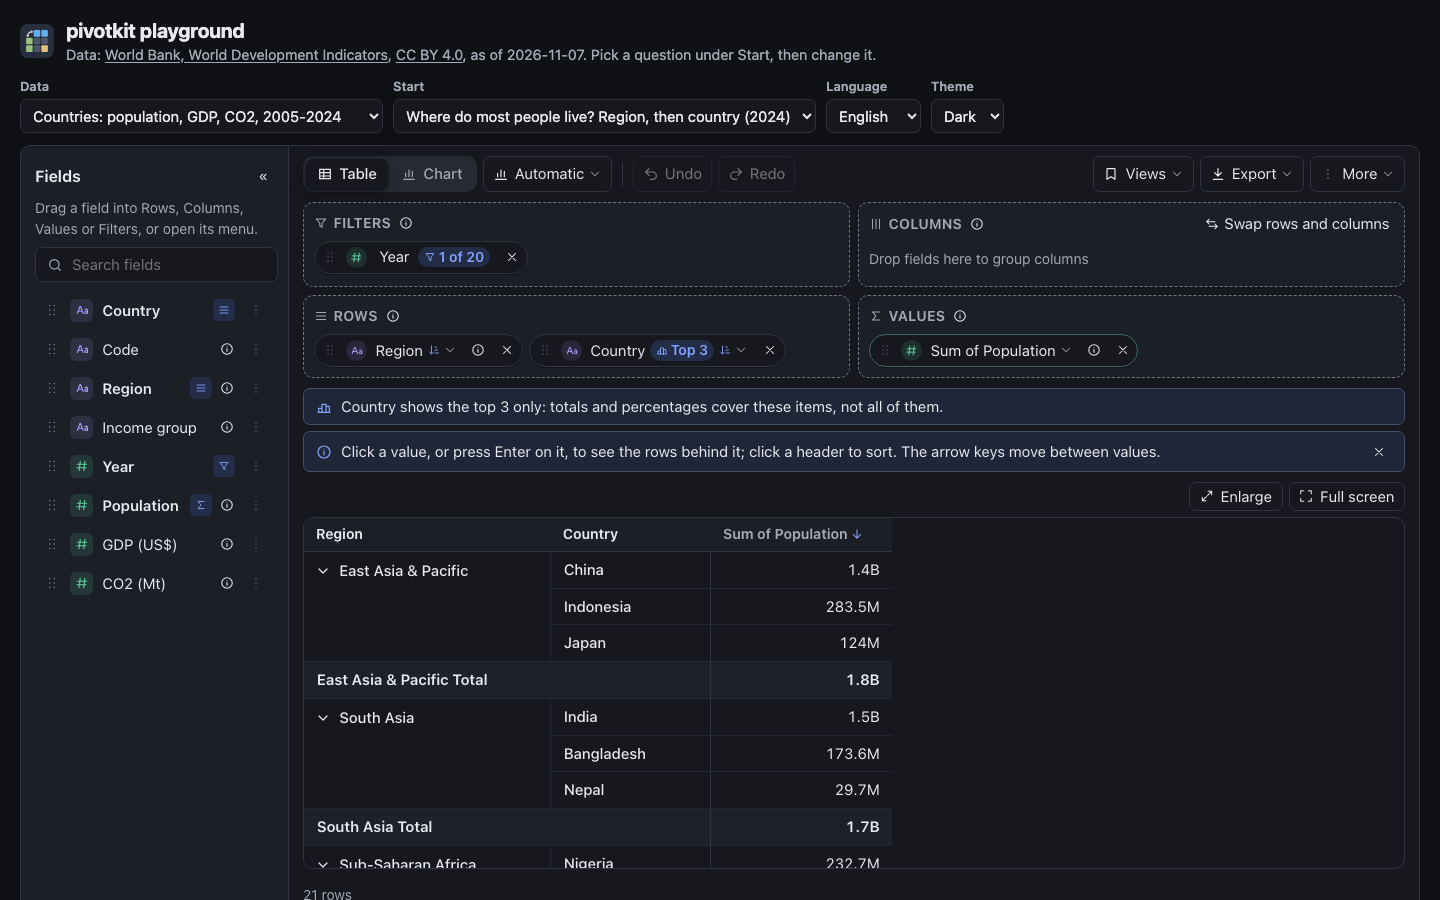
The report adapts to the room it has: the field list folds away, the zones fold into one line, menus open from the bottom on a phone. Enlarge and Full screen give the result all the room. Tips above the result say what the report shows; an i explains a setting; long menus fold their sections.
More room for the result
| Button | Where | Does |
|---|---|---|
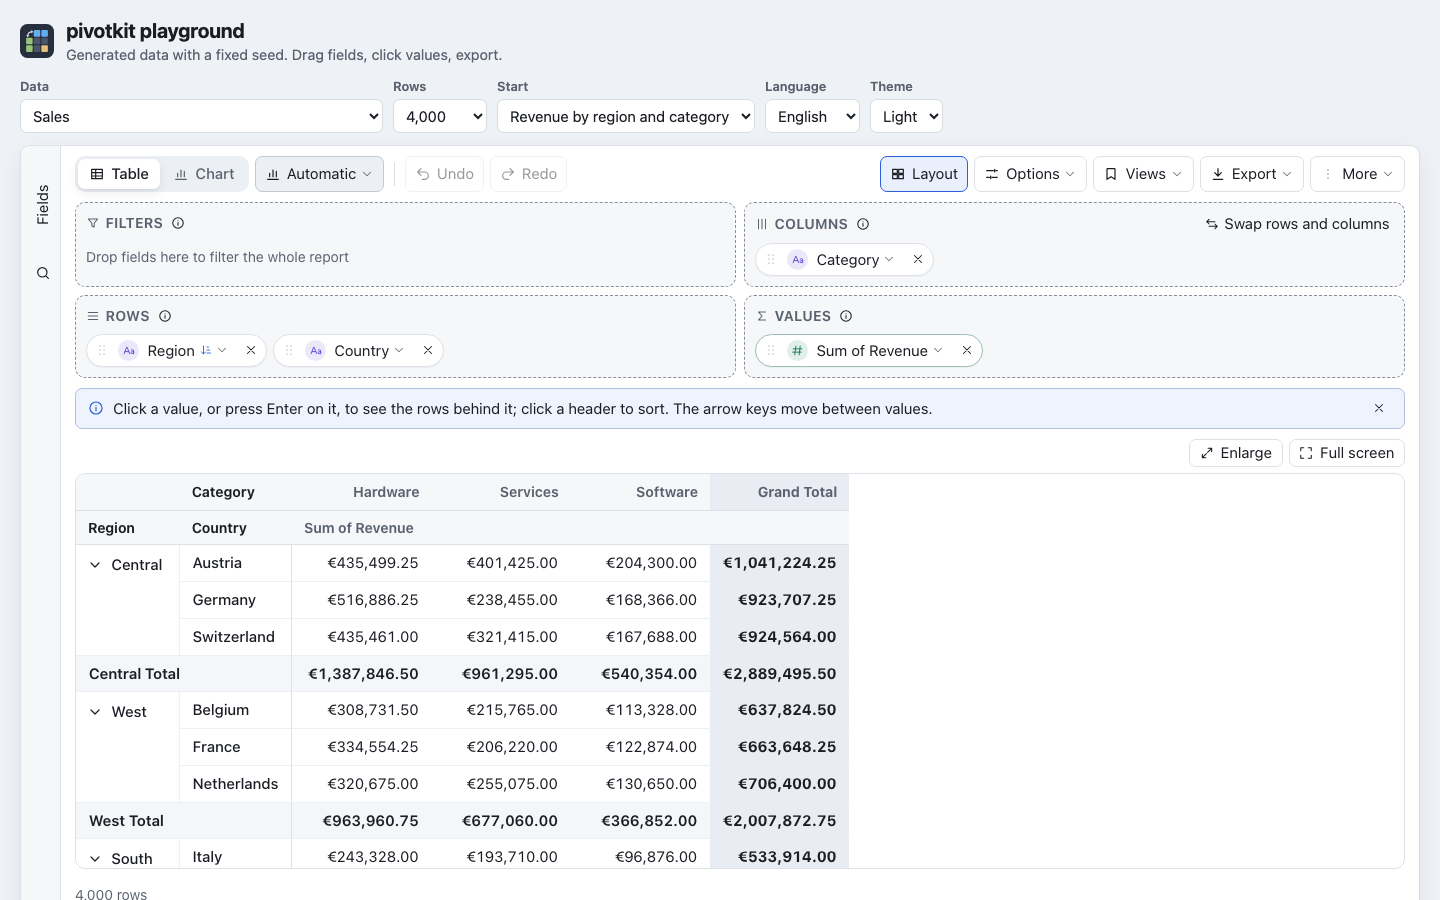
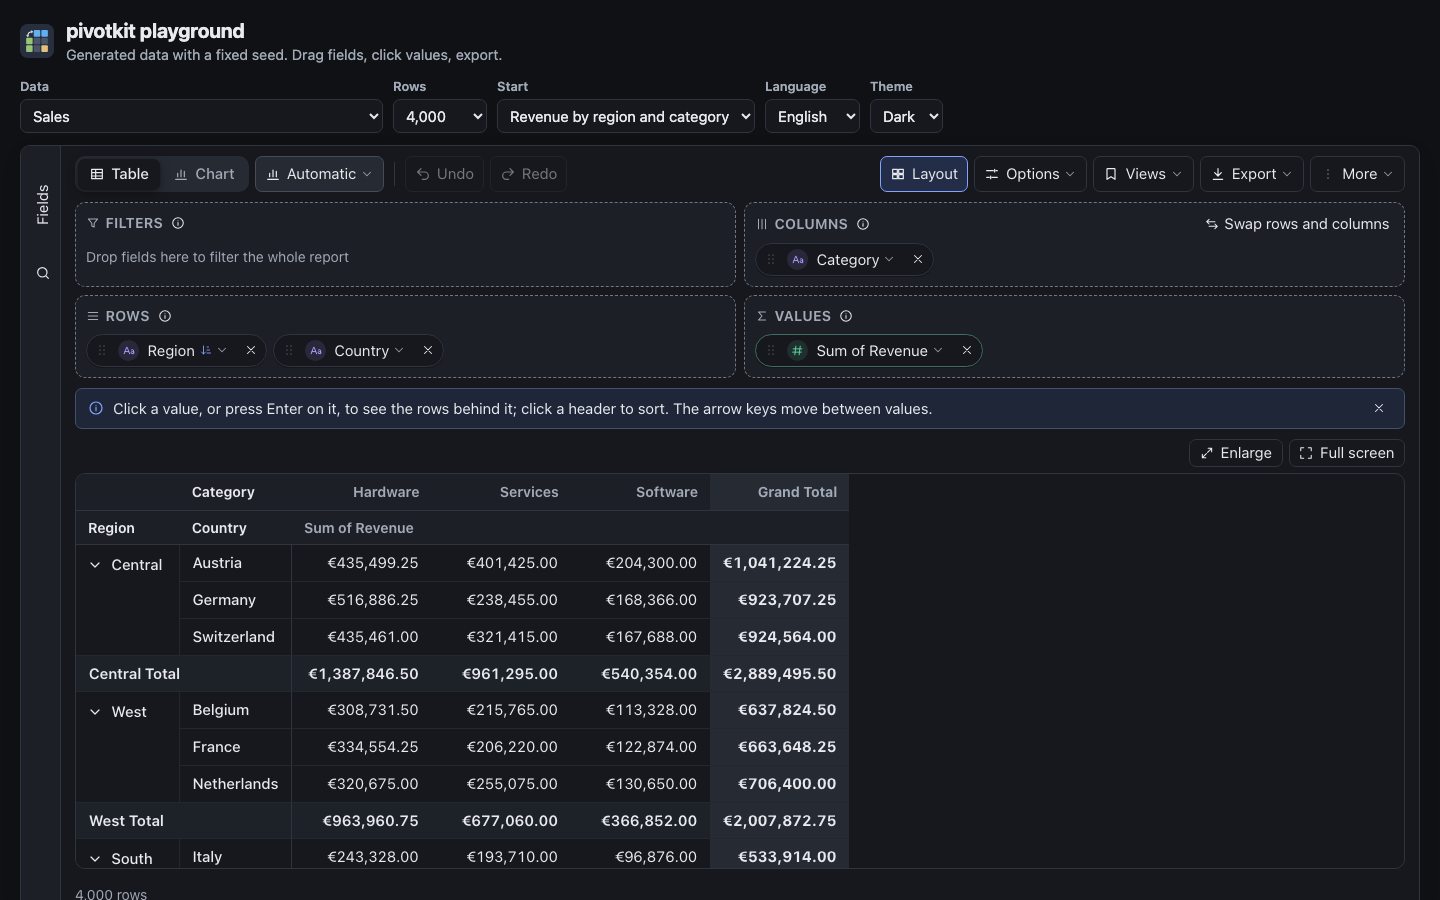
| « | next to "Fields" | Collapses the field list to a slim rail at the side of the report (about 40 px) that shows "Fields" upright and a search button: the zones and the result get its room. |
| Enlarge | top right of the result | The table or the chart fills the report (below). |
| Full screen | next to it | The whole report on the screen. |
None of them is part of the saved view.
The field rail
A click on the rail opens the list again; the search button opens it with the cursor in the search field. The focus stays on the button that takes the place of the one pressed. A chip dragged onto the rail leaves the report, as on the open list: while one is dragged, the rail reads "Drop here to remove" (a screen reader hears it). The report remembers the choice (with the tips); an application can start the list open or collapsed. On a narrow report the field list is a drawer instead (small screens). Enlarge hides the rail too.
Enlarge
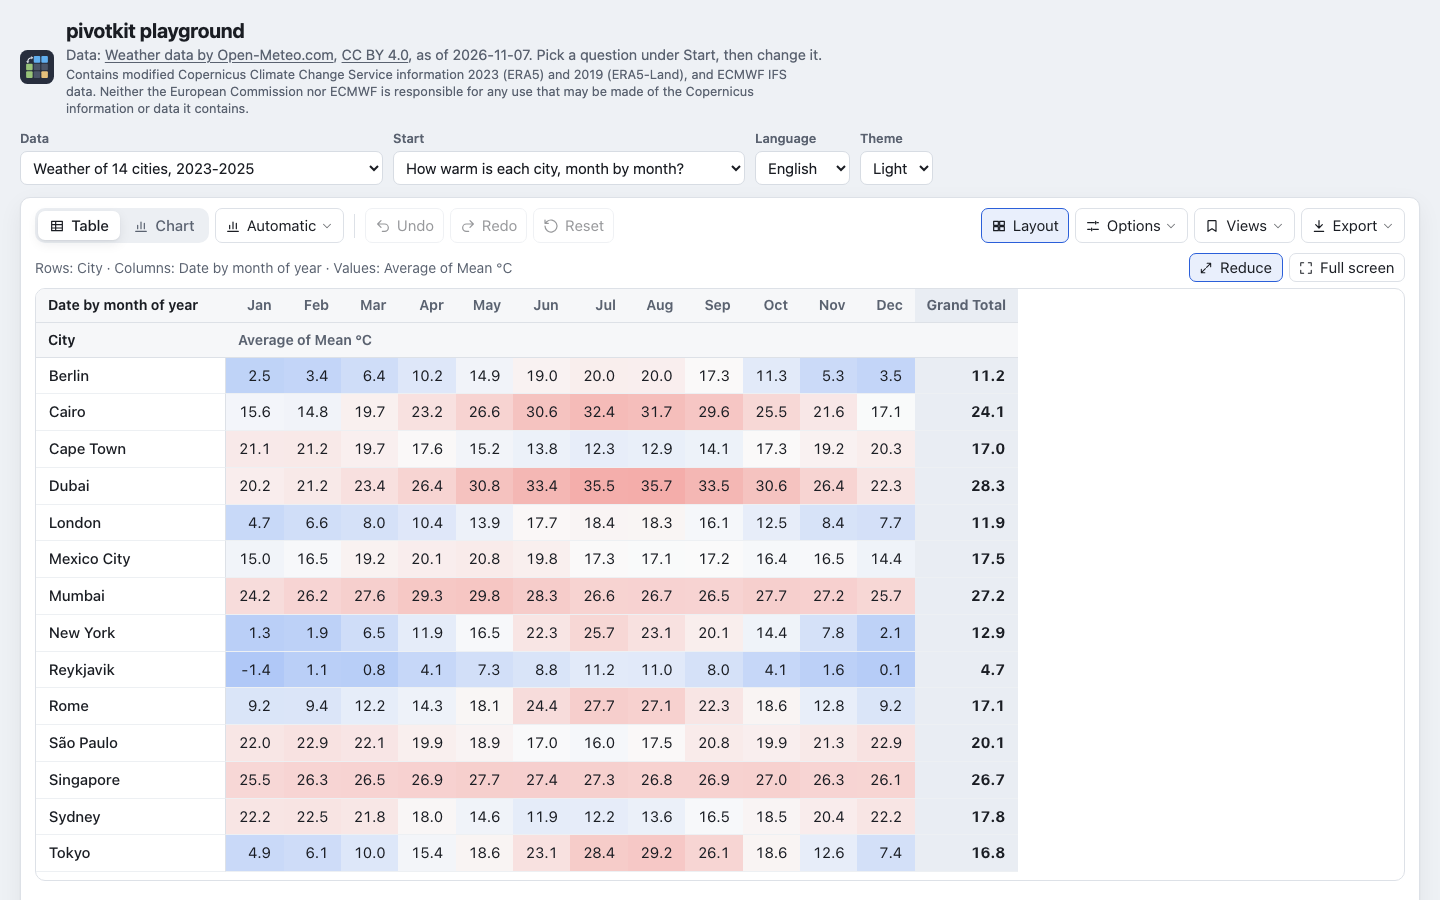
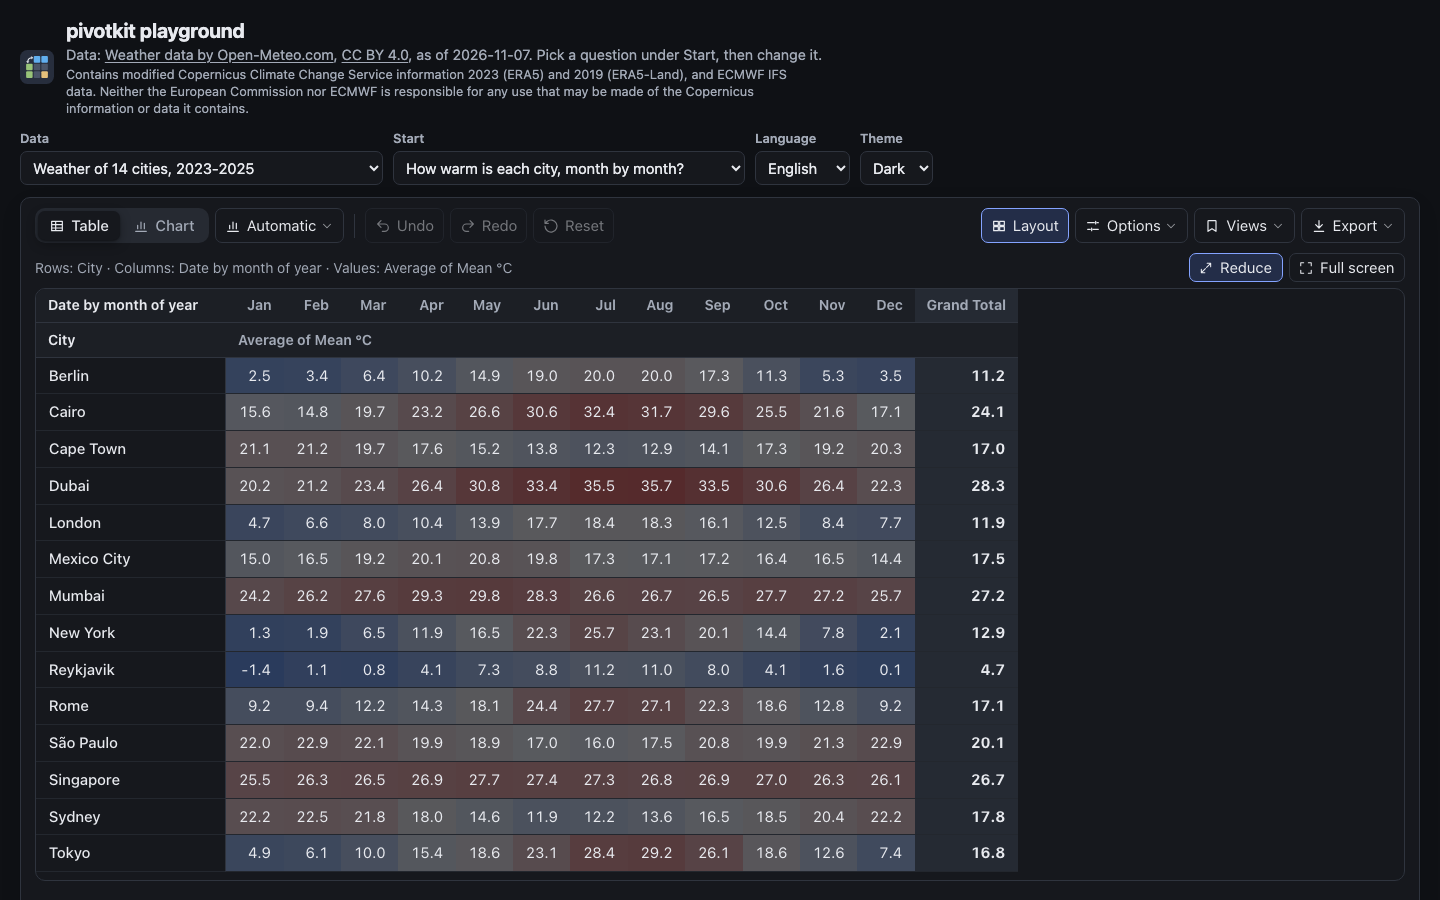
The field list, the zones, the tips and the notes above the result step aside, and one line says which fields the report shows ("Rows: Team · Columns: Priority · Values: Count of Ticket"). The toolbar stays. Escape or the same button, which then reads Reduce (in German Verkleinern) and is highlighted, brings everything back. Its name says what a click does, so a screen reader hears "Enlarge" or "Reduce", not a pressed switch. The drill-down's Enlarge works the same.
Full screen
Escape or the button leaves it. It is offered only where the browser can do it (not, for example, in Safari on an iPhone); it works in the web component too.
Small screens
The report adapts to its own width, not the window's.
| Report width | Layout |
|---|---|
| Wide | The field list on the left, the zones in a 2 x 2 grid. |
| Narrow (below 640 px of the report's own width) | The field list is a drawer opened with Fields in the toolbar; menus open as sheets from the bottom of the window. |
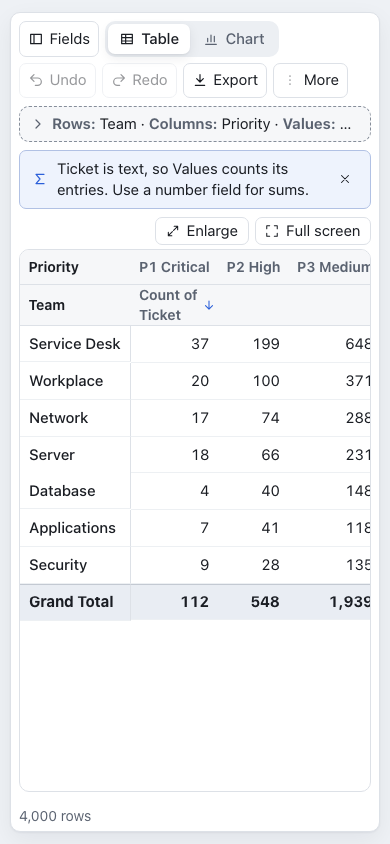
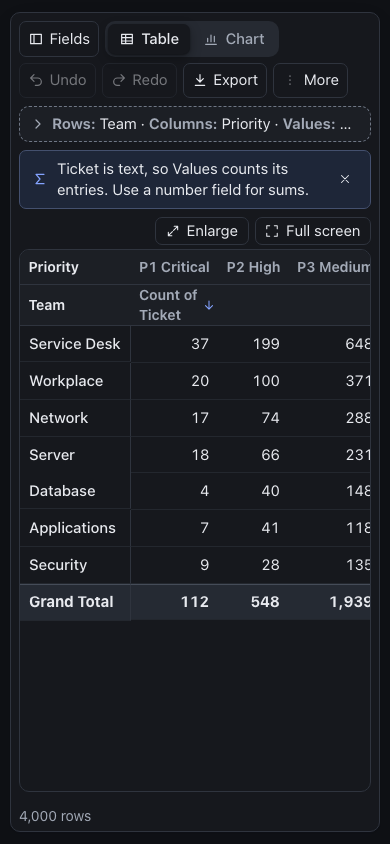
- The drawer closes with its x ("Close field list"), Escape or a tap beside it, and by itself once a field is added from it, its "Filter…" opens or a drag starts, so you see where the field lands.
- Sheets: on a phone More and every menu are a sheet at the bottom of the window, at most 82 % of its height, scrolling inside: every entry is reachable.
- More: toolbar buttons that do not fit move into More, always in the same order - Reset first, then Layout, Options, the chart type and Views last, so Views (where you save) stays in the toolbar from a window about 1280 px wide (with the field list open). At about 1280 px the chart type is in More to make room for Views; from about 1440 px both show. Which buttons move depends on the report's width only, so the same buttons show in every language, and a click on Layout never moves it. Table or Chart, Undo with Redo next to it, and Export always stay. The name of the view you loaded takes the room that is left on its line and is shortened with "…", never to less than a few letters; a tap on it opens Views.
- The table: row labels wrap between words; a table wider than the phone scrolls sideways.
A low report
When the report is low (below 600 px; a narrow one below 820 px), the zones fold into one line that says what is in them ("Rows: Team · Columns: Priority · Values: Count of Ticket"), and at most one tip shows. A click on the line, or Layout in the toolbar, opens them. Layout keeps its name and shows pressed while the zones are open; in More it is an entry with a check. A drag from the field list or the table opens them while it lasts.
When the report's box is lower than its toolbar, its zones, its tips and the least height of the result need (240 px, 280 px on a narrow report), a report with a height of the application's (a card) stays inside it and its table scrolls; a report without one grows and the page scrolls, instead of squeezing the table into a sliver.
Menus and text fields
- A setting that needs explaining has an i next to it: pointing at it or moving the focus to it shows the explanation, a tap opens it. It is the same i everywhere (totals, Show as, Along, the export formats, the chart's Labels and Group labels), so every menu row stays one line. Options, Help, Show explanations hides them all.
- Every text field in a menu - the field search, a value's name, "Starting at" of number ranges, a saved view's name, the text of a filter condition, the box of Load view - has an × while it holds text. It empties the field and keeps the focus there; Ctrl+Z in the field brings the text back.
- Escape in such a field empties it first; the next Escape closes the menu.
- While the report waits for its data, or opens a shared link, it shows grey shapes where the toolbar, the zones and the table will be, and a screen reader hears "Loading the report…". A large data set (more than 10,000 rows) shows them for a moment too, while it is read.
Menus that are long
- A menu keeps the mouse wheel to itself: at its end it stops, the table or the page behind it does not scroll; scrolling a long menu by touch stops at its end too. A menu is never higher than the window; what does not fit scrolls inside it.
- Entries few people need sit behind a link in their section: More statistics, More calculations, More formats (whole number, compact, bytes, durations).
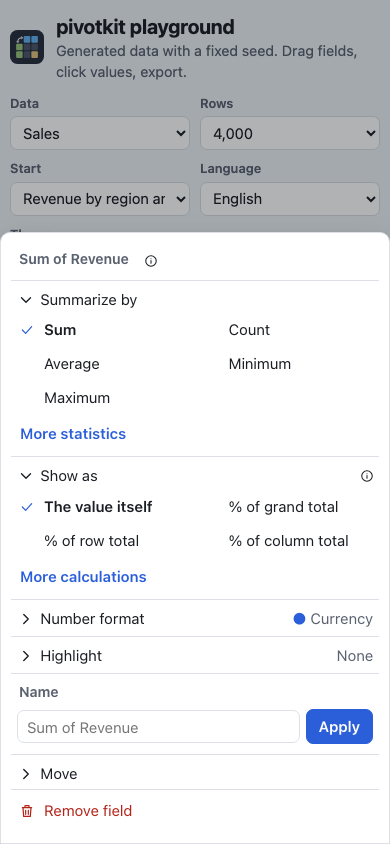
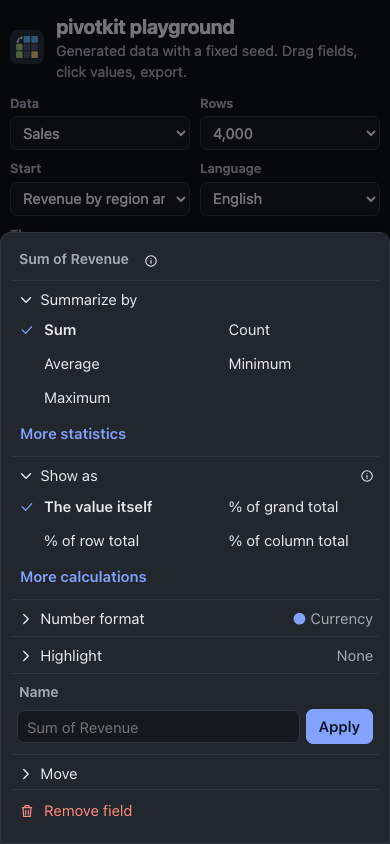
Sections fold with their title, a button (44 px high on a touch screen). The ones used most are open. A folded section says at its end what it holds, muted ("Number format · Automatic", "Highlight · None"), so you see what is set without opening it. A dot in the accent colour before it means the setting is not the one the report starts with ("Number format · ● Currency"); a screen reader hears "Number format, Currency, changed". The report remembers what you open and fold (with the tips, under the report's storage), Show dismissed tips again leaves it as it is, and Options, Help, Reset menu sections folds and opens every section as at first (greyed out while nothing differs).
| Menu | Open | Folded |
|---|---|---|
| A value's menu | Summarize by, Show as | Number format, Highlight, Move (Name does not fold) |
| A row or column field's menu | Sort, Filters, Top items, the date grouping, number ranges | Move |
| Views | This view, Shared views, My views | Share |
| Chart type | Chart type | Display |
| Options, Export, the drill-down's Export | all (Options, Rows does not fold) |
Tips
Short tips above the result say what the report shows and what you can do next. One shows at a time, the most important first; the next waits until it is followed or dismissed. They are never over the table.
| A tip says | With |
|---|---|
| a top 5 changes what the totals mean | |
| what 100 % is for a percentage | |
| a text field in Values is counted | |
| a date makes a column per day | a button to group it by month |
| a filter leaves nothing | Remove filter |
| the view could be saved | Save view, which opens Views; after a save it waits for more changes |
| a chart over dates reads better as lines | Show as lines over time |
| a pie has too many slices | Switch to Bars |
- The x of a tip (Tab reaches it) hides that tip; the report remembers it.
- The notes that say the result is cut or empty (a top 5, the first 50 categories of a chart, a filter that leaves nothing) always stay; they have no x.
- Options, Help has Show tips, to switch them all off and on, Show explanations (every i: of the fields, the zones and the settings of the menus), Show dismissed tips again (greyed out until you dismissed a tip; the menus' sections stay as you folded them) and Reset menu sections. The report remembers the switches like the tips.
- Options, Help, Keyboard shortcuts lists the keys (keyboard).
In German
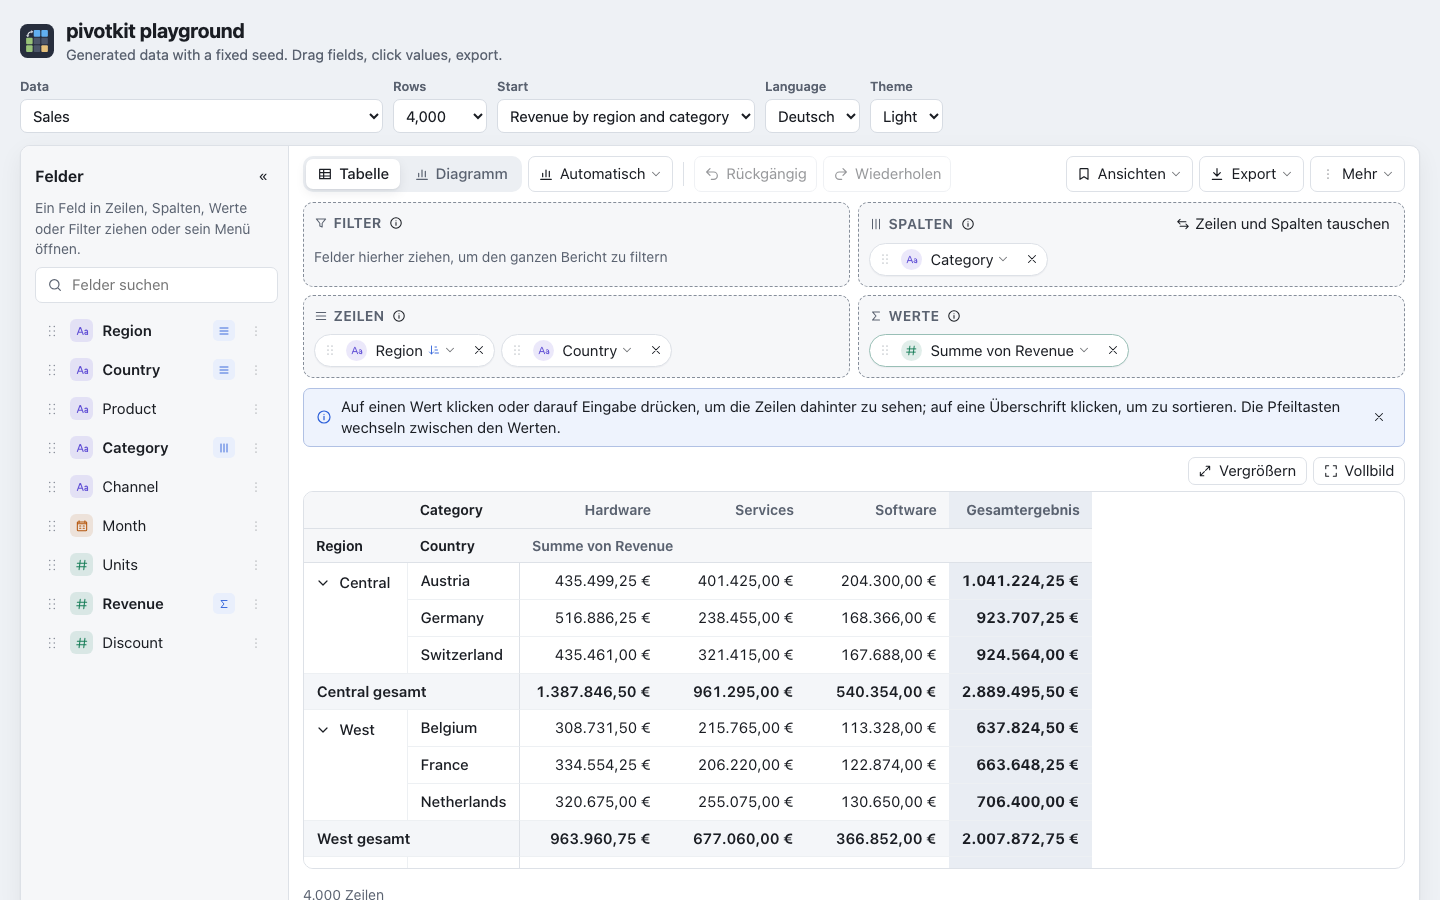
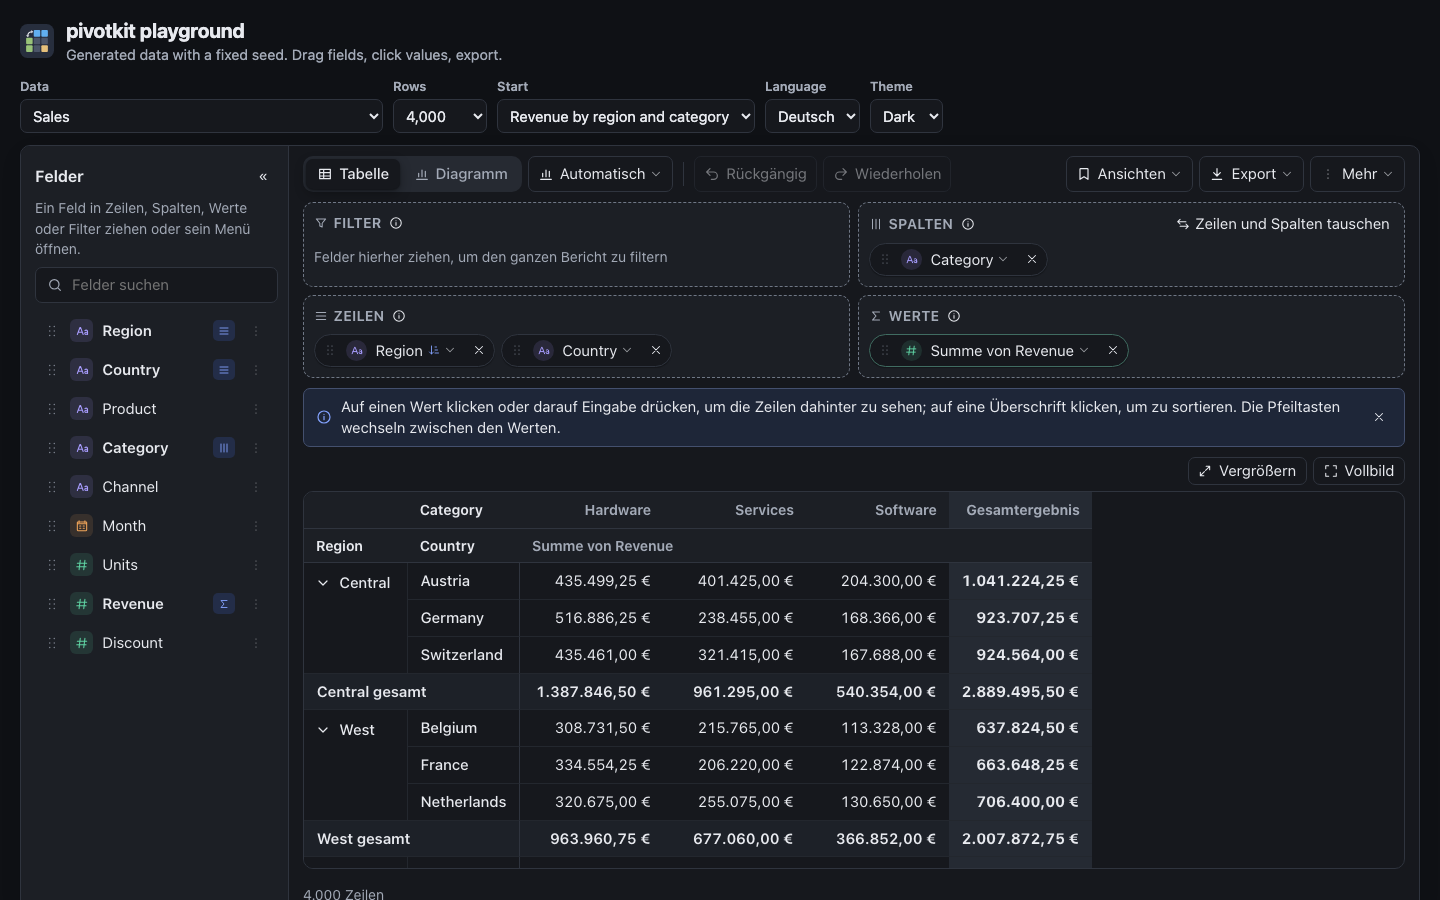
The report speaks English and German; numbers, dates and currency follow the language as well.
For developers
The report's height, grow, fieldList, the width classes and the least heights are in the
pivotkit-react reference, Layout; the tips, their ids and
storageKey in Tips; the texts and languages in
Localisation.