Learn with real data
The live demo has five real public data sets next to the generated ones. Each comes with templates phrased as questions: pick one under Start in the playground's header, read the answer, then change the report with the tasks below. Every task says what you should see, so you know when you got it right.
Open the playground with the weather data
| Data set | Rows | Fields | Source and licence |
|---|---|---|---|
| Weather of 14 cities, 2023-2025 | 15,344 days | City, Country, Continent, Date, Season, Max °C, Min °C, Mean °C, Rain mm, Rain day, Sunshine h | Weather data by Open-Meteo.com, CC BY 4.0; contains modified Copernicus Climate Change Service information (attribution) |
| Countries, 2005-2024 | 4,340 country-years | Country, Code, Region, Income group, Year, Population, GDP (US$), CO2 (Mt) | World Bank, World Development Indicators, CC BY 4.0 |
| Earthquakes of magnitude 4.5+, 2025 | 8,559 quakes | Time, Magnitude, Depth km, Place, Region, Latitude, Longitude, Alert, Tsunami flag | U.S. Geological Survey, public domain |
| Nobel Prize laureates, 1901-2026 | 1,036 prizes | Laureate, Type, Gender, Category, Year, Share, Age at award, Country | Nobel Prize Outreach, CC0 |
| Software end of life, 489 products | 9,374 release cycles | Product, Category, Cycle, Released, EOL date, EOL, Maintained, LTS, Active support until, Support years, Days to EOL, Latest version, Latest release, Release year, Tags | endoflife.date, MIT |
The data are snapshots fetched once on 2026-11-07 and stored with the playground; the page makes no
call to these services. How each snapshot was made, what was changed and the full terms of each
source are in
examples/playground/data/SOURCES.md.
At the end of each section: how to query the source yourself, live.
Before you start
- Rows, Columns, Values, Filters: drag a field from the list into a zone, or open the field's menu (the three dots) and pick "Add to Rows". Use a report explains every part.
- The chip menu (the small arrow on a field in a zone) groups dates, sorts, filters, keeps the top N, and for a value changes the aggregator, the "show values as" and the format.
- Undo takes back every step; the Start list in the header brings back a template.
Weather
Daily values of 14 cities on six continents for 2023, 2024 and 2025: the highest, lowest and mean temperature, rain and sunshine. "Rain day" is 1 on a day with at least 1 mm of rain, so its sum counts rain days. "Season" is the meteorological season, swapped south of the equator: December in Sydney is summer.
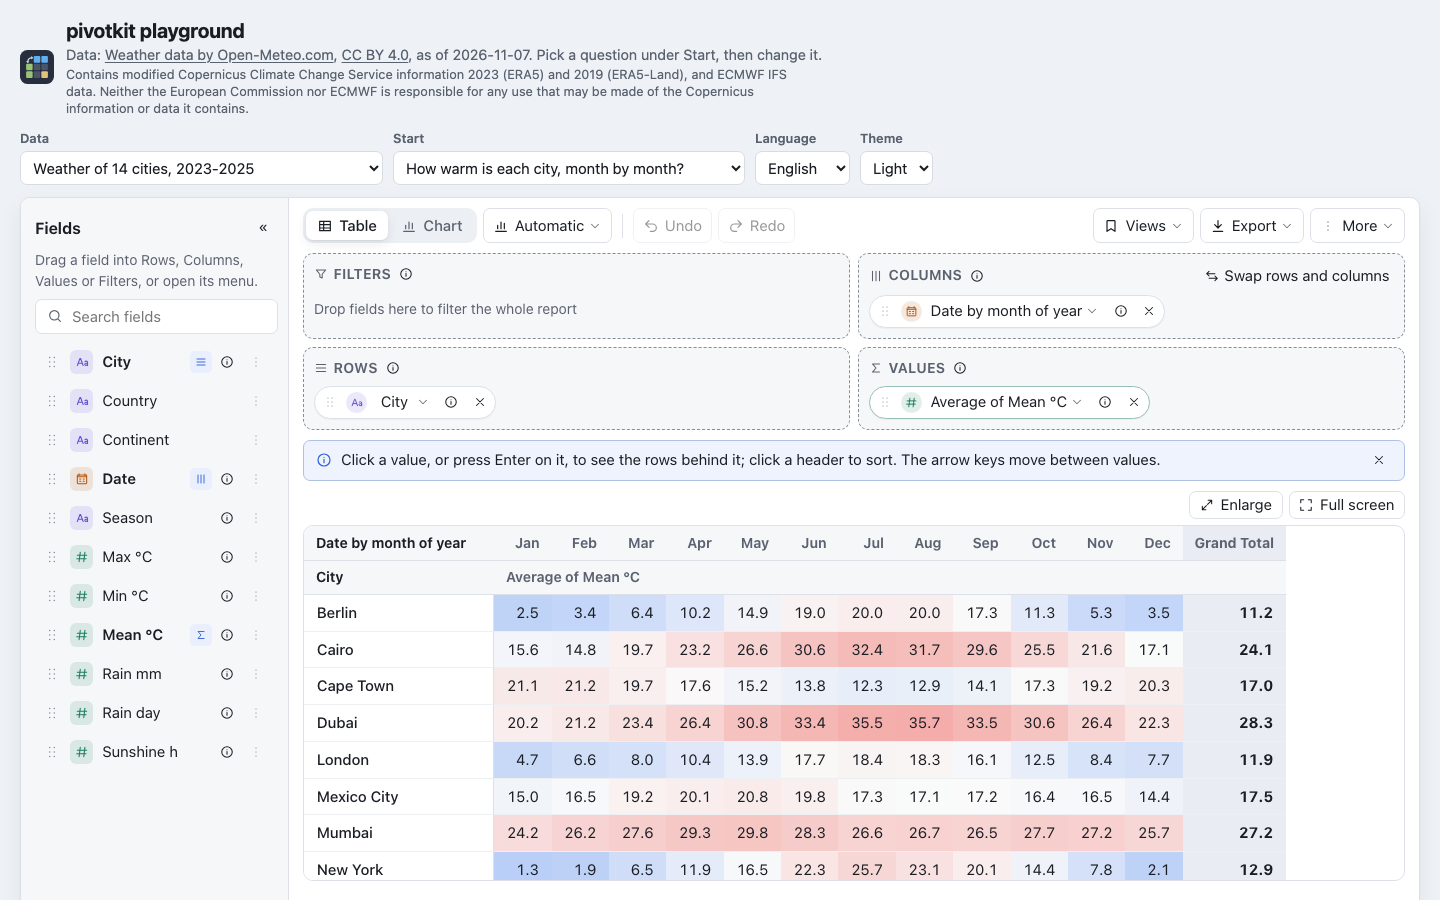
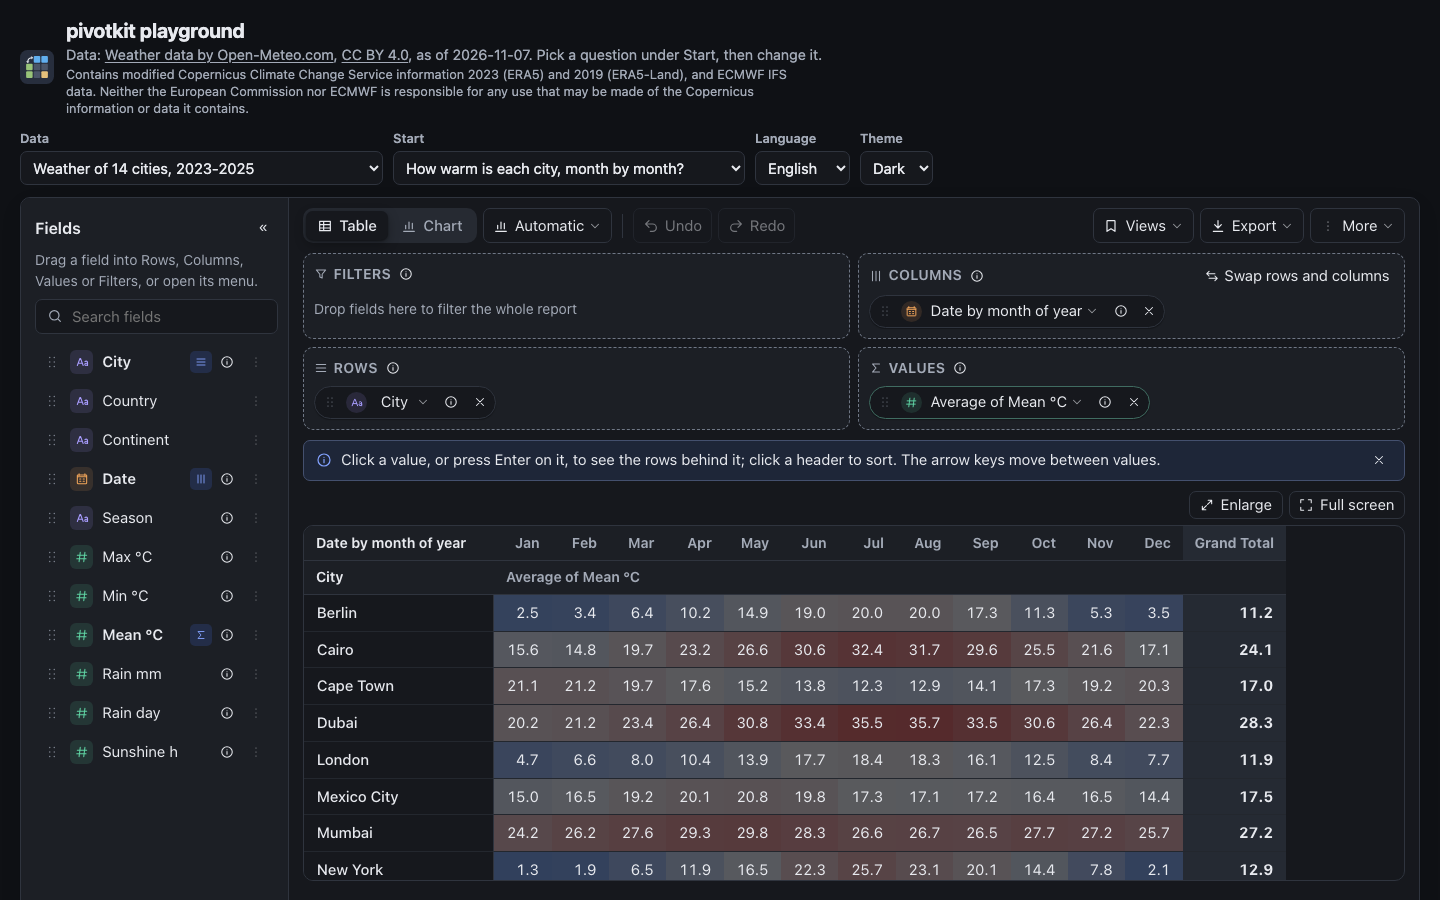
How warm is each city, month by month? Cities on rows, the month on columns (across all three years), the average of "Mean °C" coloured from cold to warm.
- Read it: Reykjavik is the coldest city (‑1.4 °C in January), Dubai the hottest (35.7 °C in August). Cape Town, Sydney and São Paulo are warm in January and cool in July: the southern hemisphere.
- Try this: open the menu of "Average of Mean °C" and pick Maximum instead of Average. The table now shows the highest daily mean of each month.
- Try this: click Swap rows and columns. The months go down, the cities across.
Which city is the sunniest? (top 3) The average sunshine hours per day, filtered to the top 3.
- Read it: Cairo (11.1 hours a day), Mexico City (10.8) and Dubai (10.7). A note above the table says that the Grand Total covers these three cities only.
- Try this: open the menu of "City", set Count under Top to 5 and press Apply. Cape Town and Rome follow.
- Try this: drag "Date" to Columns. The report groups the dates by quarter on its own ("Date by quarter") since they span three years; the chip's menu switches to months or years.
How many rain days per season? (2025) Cities on rows, seasons on columns, the sum of "Rain day", filtered to 2025 with the derived field "Year".
- Read it: Singapore has the most rain days (286 in 2025), Cairo the fewest (5). Half of Cape Town's 75 fall in its winter (38). Mumbai has none in winter and 90 in its summer monsoon.
- Try this: open the menu of "Rain days" and pick Show as: % of row total. Each row now adds up to 100 %: the share of a city's rain days per season.
- Try this: open the menu of "Season" and pick A to Z, then Custom order again. The seasons
follow the year (Spring, Summer, Autumn, Winter) instead of the alphabet: the playground gives
"Season" this order (
fieldDefaults), as Excel's custom lists do, and the template, which has no sort for "Season", uses it.
Was 2025 warmer than 2023 in Berlin? (chart) One line per year, filtered to Berlin.
- Read it: February 2025 was the coldest month of the three years (0.6 °C), February 2024 a mild one (6.6 °C).
- Try this: open the filter of "City" (its chip in Filters) and pick Reykjavik instead of Berlin.
- Try this: switch to Table, then Export > Excel. The workbook holds the same numbers with all their decimals.
Query it live
https://archive-api.open-meteo.com/v1/archive?latitude=52.52&longitude=13.41&start_date=2025-07-01&end_date=2025-07-31&daily=temperature_2m_max,temperature_2m_min,temperature_2m_mean,precipitation_sum,sunshine_duration&timezone=auto
- Key: none for non-commercial use; a commercial product needs Open-Meteo's paid plan (terms).
- Limits: 600 calls a minute, 5,000 an hour, 10,000 a day; a request of more than two weeks or more than 10 variables counts as several calls.
- Licence: CC BY 4.0. Show "Weather data by Open-Meteo.com" with a link next to the data.
- Underlying data: ECMWF IFS, ERA5 and ERA5-Land. For ERA5 and ERA5-Land the Copernicus Climate Data Store asks for this attribution, which the playground shows too: "Contains modified Copernicus Climate Change Service information 2023 (ERA5) and 2019 (ERA5-Land), and ECMWF IFS data. Neither the European Commission nor ECMWF is responsible for any use that may be made of the Copernicus information or data it contains." The citations are in SOURCES.md.
The JavaScript examples import the request and the mapping from
sources.js, a
plain module without dependencies: save it next to your script, or paste the functions shown under
each example.
import { WEATHER, weatherUrl, weatherRows } from "./sources.js";

const berlin = WEATHER.cities.find((c) => c.city === "Berlin");
const response = await (await fetch(weatherUrl(berlin, "2025-07-01", "2025-07-31"))).json();
const rows = weatherRows(berlin, response);   // 31 rows for <PivotReport data={rows}>
$weather = Invoke-RestMethod 'https://archive-api.open-meteo.com/v1/archive?latitude=52.52&longitude=13.41&start_date=2025-07-01&end_date=2025-07-31&daily=temperature_2m_max,temperature_2m_min,temperature_2m_mean,precipitation_sum,sunshine_duration&timezone=auto'
$weather.daily.time.Count   # 31
Hand the response to the page as JSON ($weather | ConvertTo-Json -Depth 5) and turn it into
rows there with weatherRows, the mapping below.
The mapping that made the snapshot, from
sources.js:
/** Daily weather of 14 cities, 2023 to 2025 (Open-Meteo Historical Weather API, ERA5 and others). */
export const WEATHER = {
    start: "2023-01-01",
    end: "2025-12-31",
    cities: [
        { city: "Reykjavik", country: "Iceland", continent: "Europe", latitude: 64.15, longitude: -21.94 },
        { city: "London", country: "United Kingdom", continent: "Europe", latitude: 51.51, longitude: -0.13 },
        { city: "Berlin", country: "Germany", continent: "Europe", latitude: 52.52, longitude: 13.41 },
        { city: "Rome", country: "Italy", continent: "Europe", latitude: 41.89, longitude: 12.48 },
        { city: "Cairo", country: "Egypt", continent: "Africa", latitude: 30.04, longitude: 31.24 },
        { city: "Cape Town", country: "South Africa", continent: "Africa", latitude: -33.92, longitude: 18.42 },
        { city: "Dubai", country: "United Arab Emirates", continent: "Asia", latitude: 25.2, longitude: 55.27 },
        { city: "Mumbai", country: "India", continent: "Asia", latitude: 19.08, longitude: 72.88 },
        { city: "Singapore", country: "Singapore", continent: "Asia", latitude: 1.35, longitude: 103.82 },
        { city: "Tokyo", country: "Japan", continent: "Asia", latitude: 35.68, longitude: 139.69 },
        { city: "Sydney", country: "Australia", continent: "Oceania", latitude: -33.87, longitude: 151.21 },
        { city: "New York", country: "United States", continent: "North America", latitude: 40.71, longitude: -74.01 },
        { city: "Mexico City", country: "Mexico", continent: "North America", latitude: 19.43, longitude: -99.13 },
        { city: "São Paulo", country: "Brazil", continent: "South America", latitude: -23.55, longitude: -46.63 }
    ]
};

/** The request for one city: daily values in the city's own time zone. No key needed. */
export function weatherUrl({ latitude, longitude }, start = WEATHER.start, end = WEATHER.end) {
    const q = new URLSearchParams({
        latitude: String(latitude),
        longitude: String(longitude),
        start_date: start,
        end_date: end,
        daily: "temperature_2m_max,temperature_2m_min,temperature_2m_mean,precipitation_sum,sunshine_duration",
        timezone: "auto"
    });
    return `https://archive-api.open-meteo.com/v1/archive?${q}`;
}

const SEASONS = ["Winter", "Winter", "Spring", "Spring", "Spring", "Summer", "Summer", "Summer", "Autumn", "Autumn", "Autumn", "Winter"];

/** Meteorological season of a month (1-12); south of the equator the seasons are swapped. */
export function season(month, latitude) {
    return SEASONS[latitude < 0 ? (month + 5) % 12 : month - 1];
}

/** One row per city and day from the response of `weatherUrl(city)`. */
export function weatherRows(city, response) {
    const d = response.daily;
    return d.time.map((date, i) => ({
        City: city.city,
        Country: city.country,
        Continent: city.continent,
        Date: date,
        Season: season(Number(date.slice(5, 7)), city.latitude),
        "Max °C": d.temperature_2m_max[i],
        "Min °C": d.temperature_2m_min[i],
        "Mean °C": d.temperature_2m_mean[i],
        "Rain mm": d.precipitation_sum[i],
        // 1 on a day with at least 1 mm: its sum counts the rain days, its average is their share
        "Rain day": d.precipitation_sum[i] === null ? null : d.precipitation_sum[i] >= 1 ? 1 : 0,
        // the API gives seconds
        "Sunshine h": d.sunshine_duration[i] === null ? null : Math.round(d.sunshine_duration[i] / 360) / 10
    }));
}
Countries
Population, GDP in current US dollars and CO2 emissions (million tonnes, without land use) of 217 countries from 2005 to 2024, with the World Bank's region and income group. Aggregates such as "World" are left out, so a total over countries is the world. "Year" is a number field.
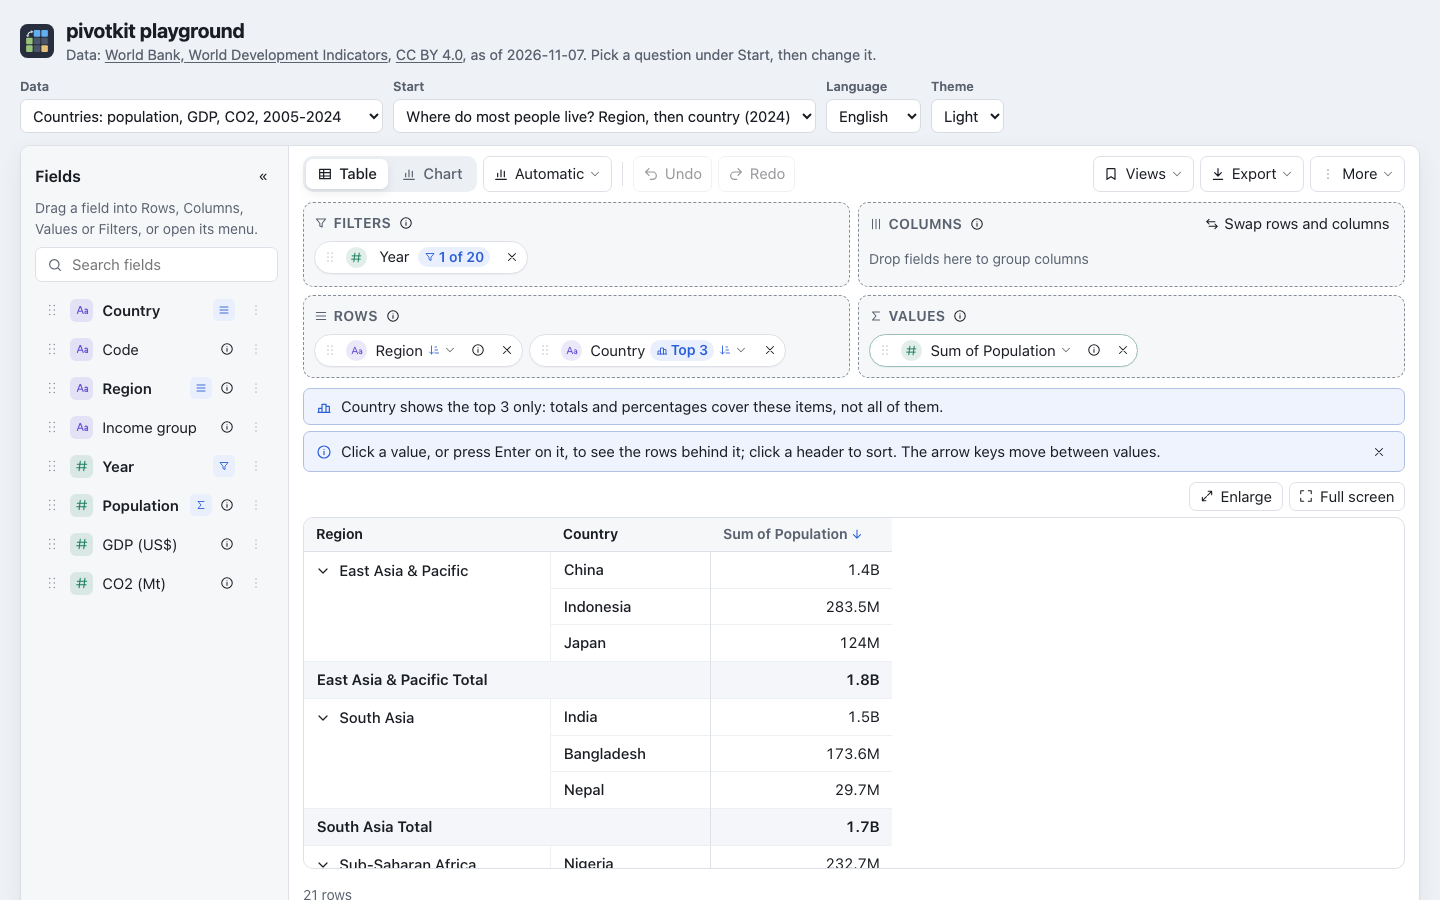
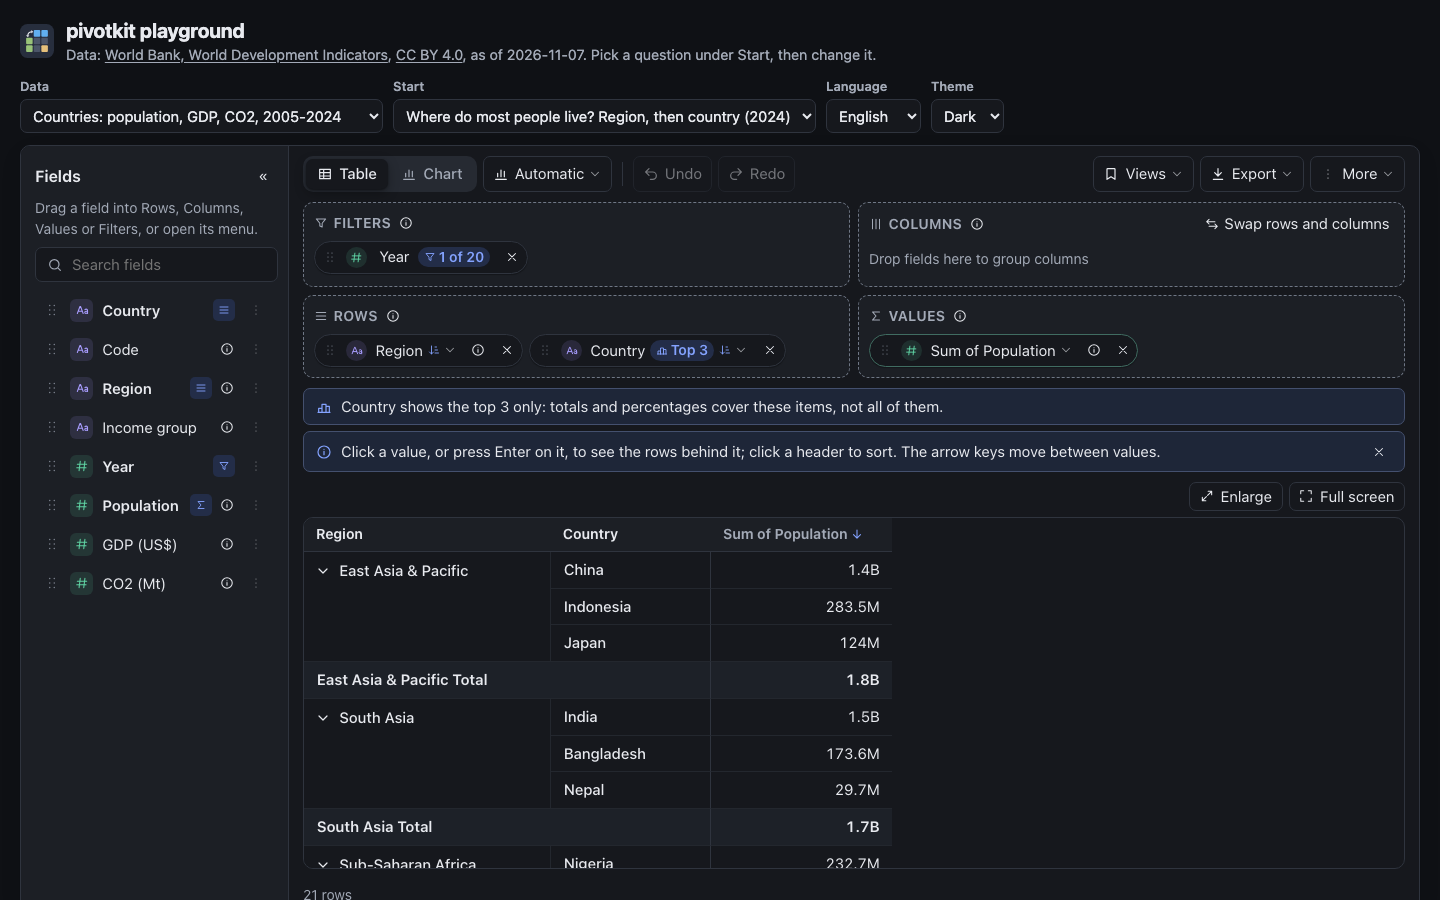
Where do most people live? Region, then country (2024) Region and country on rows, the sum of population, filtered to 2024 and to the top 3 countries of each region.
- Read it: East Asia & Pacific comes first; its three largest countries (China 1.4B, Indonesia 283.5M, Japan 124M) add up to 1.8B. South Asia follows with India (1.5B).
- Try this: click the arrow before a region to collapse it; the subtotal stays.
- Try this: remove the top 3 (the chip menu of "Country", Remove under Top and Count). Every country shows, and the region totals are the regions' populations.
What share of the world's CO2 comes from each region? Regions on rows, five years on columns, CO2 shown as % of column total.
- Read it: East Asia & Pacific's share grew from 33.5 % (2005) to 45.8 % (2024); North America's fell from 22.6 % to 13.7 %. Every column adds up to 100 %.
- Try this: change Show as to The value itself. The cells show million tonnes.
- Try this: add "Population" to Values. Two values side by side under every year.
How much did GDP change from the year before? Income groups on rows, 2019 to 2024 on columns, GDP shown as % difference from previous along the columns.
- Read it: 2020 shrank the world's GDP by 2.8 %, 2021 grew it by 14.2 % (current dollars, not adjusted for inflation). The 2019 column is empty: the year before it is filtered out, as in Excel.
- Try this: open the filter of "Year" and add 2018. Now 2019 has a value and 2018 is the empty column.
- Note: each year's sum covers the countries that have a value for that year. A country whose GDP is missing in one of two years counts in one sum only, which moves the change a little.
How has population grown per income group? (chart) Years on rows, income groups as stacked bars.
- Read it: from 6.6 billion people in 2005 to 8.1 billion in 2024; the lower middle income group grew the most, from 2.2 to 2.9 billion.
- Try this: pick Chart type: Lines, then switch to Table and Export > CSV.
Query it live
https://api.worldbank.org/v2/country?format=json&per_page=400
https://api.worldbank.org/v2/country/all/indicator/SP.POP.TOTL?format=json&date=2024&per_page=20000
- Key: none. No rate limit is documented; send one request per indicator, not one per country.
- Licence: CC BY 4.0. Name "World Bank, World Development Indicators" with the data.
- The other two indicators:
NY.GDP.MKTP.CD(GDP, current US$) andEN.GHG.CO2.MT.CE.AR5(CO2).
import { countriesUrl, indicatorUrl, countryRows } from "./sources.js";

const countries = await (await fetch(countriesUrl)).json();
const population = await (await fetch(indicatorUrl("SP.POP.TOTL", "2024"))).json();
const rows = countryRows(countries, { Population: population });   // 217 rows
$countries = Invoke-RestMethod 'https://api.worldbank.org/v2/country?format=json&per_page=400'
$population = Invoke-RestMethod 'https://api.worldbank.org/v2/country/all/indicator/SP.POP.TOTL?format=json&date=2024&per_page=20000'
$population[1].Count   # 266, aggregates included; countryRows leaves them out
/** Population, GDP and CO2 per country and year (World Bank, World Development Indicators). */
export const COUNTRIES = {
    years: "2005:2024",
    indicators: {
        Population: "SP.POP.TOTL",
        "GDP (US$)": "NY.GDP.MKTP.CD",
        "CO2 (Mt)": "EN.GHG.CO2.MT.CE.AR5"
    }
};

/** The country list with region and income group; aggregates such as "World" have the region "Aggregates". */
export const countriesUrl = "https://api.worldbank.org/v2/country?format=json&per_page=400";

/** One indicator for every country and year in one page. No key needed. */
export function indicatorUrl(indicator, years = COUNTRIES.years) {
    return `https://api.worldbank.org/v2/country/all/indicator/${indicator}?format=json&date=${years}&per_page=20000`;
}

/**
 * One row per country and year. `countries` is the response of `countriesUrl`, `indicators` maps each
 * field name of COUNTRIES.indicators to the response of its `indicatorUrl`. A response is
 * `[paging, records]`.
 */
export function countryRows(countries, indicators) {
    const meta = new Map();
    for (const c of countries[1]) {
        // aggregates (World, Euro area, income groups) would count every country twice
        // (the API ends a few region names with a space)
        if (c.region.value !== "Aggregates") meta.set(c.id, { name: c.name.trim(), region: c.region.value.trim(), income: c.incomeLevel.value.trim() });
    }
    const rows = new Map();
    for (const [field, response] of Object.entries(indicators)) {
        for (const r of response[1] ?? []) {
            const m = meta.get(r.countryiso3code);
            if (!m) continue;
            const key = `${r.countryiso3code}:${r.date}`;
            if (!rows.has(key)) {
                const row = { Country: m.name, Code: r.countryiso3code, Region: m.region, "Income group": m.income, Year: Number(r.date) };
                for (const f of Object.keys(indicators)) row[f] = null;
                rows.set(key, row);
            }
            // GDP to whole dollars: the cents of a country's GDP are noise
            rows.get(key)[field] = r.value === null ? null : field === "GDP (US$)" ? Math.round(r.value) : r.value;
        }
    }
    return [...rows.values()].sort((a, b) => a.Country.localeCompare(b.Country, "en") || a.Year - b.Year);
}
Earthquakes
Every earthquake of magnitude 4.5 or more in 2025, from the USGS catalogue. "Time" is in UTC. "Region" is the end of the place name ("92 km S of Lakatoro, Vanuatu" is "Vanuatu"; a place at sea such as "southern Mid-Atlantic Ridge" is its own region). "Tsunami flag" is set by USGS for large events in oceanic regions; it does not say that a tsunami happened.
How strong were the quakes? (magnitude ranges) "Magnitude" grouped in ranges of 0.5, counted, and the count again as % of grand total.
- Read it: three in four quakes (75.1 %) are between 4.5 and 5; one is between 8.5 and 9.
- Try this: open the menu of "Magnitude (by 0.5)" and set Range size to 1. The ranges keep their start: 4.5 – 5.5, 5.5 – 6.5 and so on. Set Starting at to 4 for 4 – 5, 5 – 6: 4 – 5 holds the same 6,430 quakes, as none is below 4.5.
- Try this: switch to Chart. A bar per range; the tall first bar is the 4.5 to 5 range.
Which regions shook most often? (top 10) The count of quakes per region, the largest magnitude next to it, top 10.
- Read it: Russia leads with 1,870 quakes, most of them aftershocks of the magnitude 8.8 quake off Kamchatka on 29 July; Indonesia (692) and Japan (539) follow.
- Try this: remove "Region" from Rows and add "Depth km" instead, then open its chip menu and group it in ranges of 100. Most quakes (7,430 of 8,559) are shallower than 100 km.
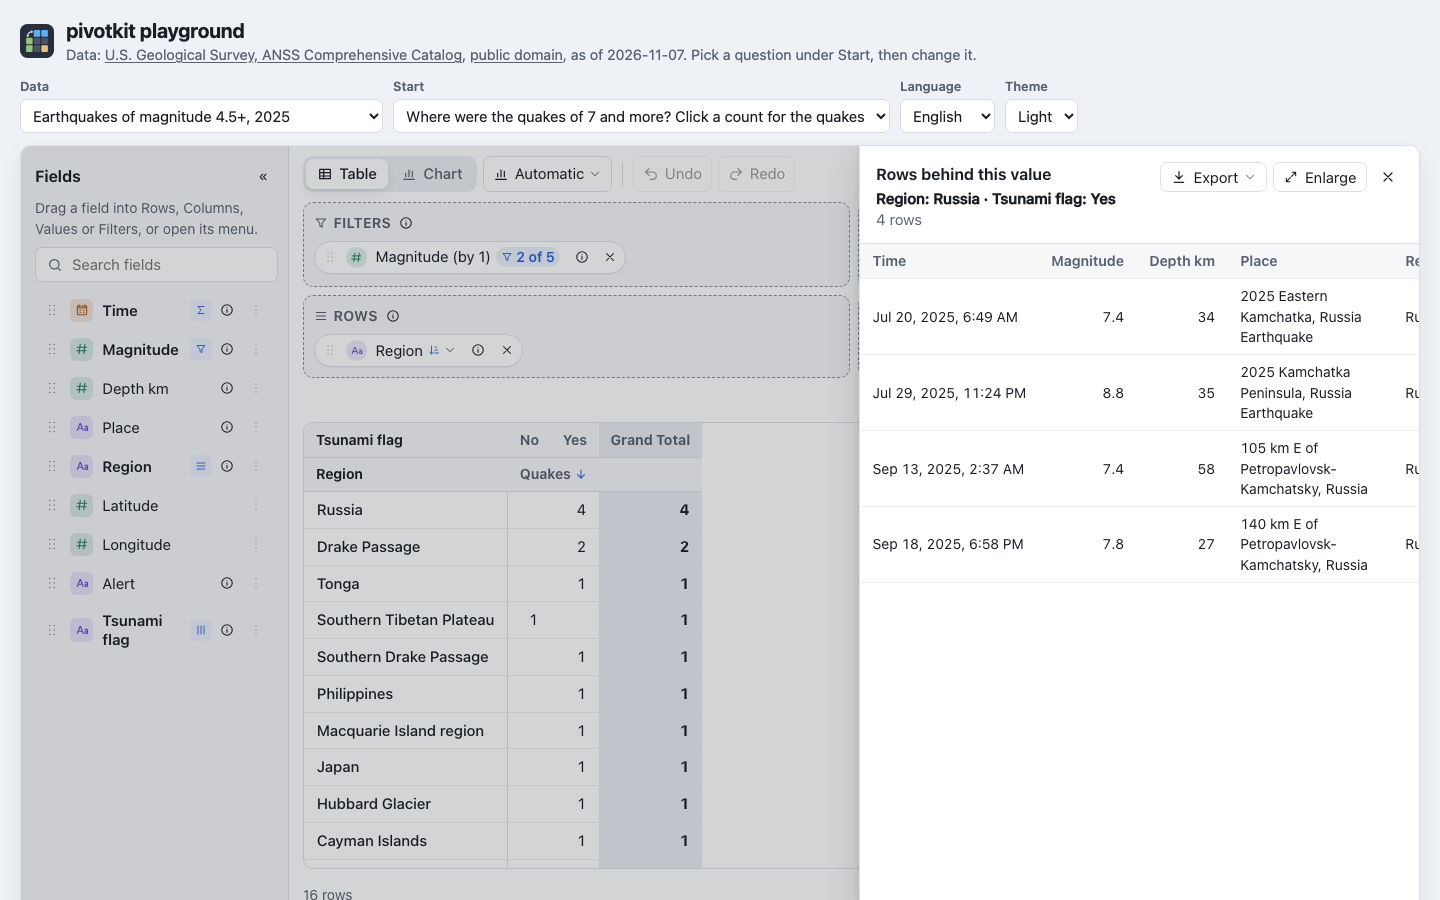
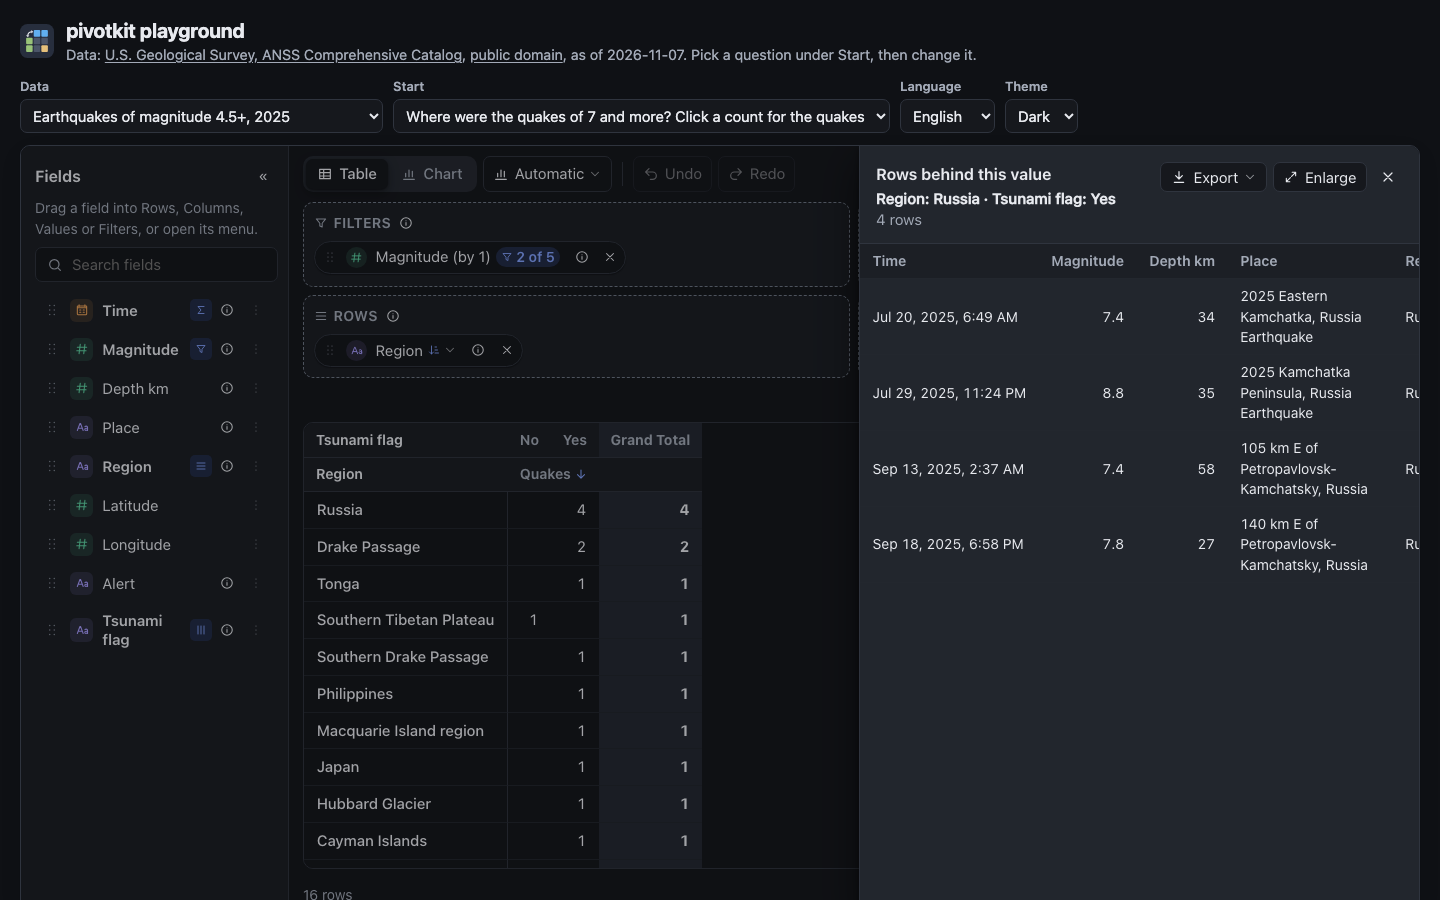
Where were the quakes of 7 and more? Click a count for the quakes Regions on rows, the tsunami flag on columns, filtered to magnitude ranges 7 and 8.
- Read it: 16 quakes of 7 and more; Russia has four.
- Try this: click Russia's 4. A panel lists the four quakes with time, magnitude, depth and place; the 8.8 is one of them. Press Escape to close it.
Did some months shake more than others? (chart) Quakes per month as bars.
- Read it: July stands out with 1,321 quakes, twice a usual month, from the Kamchatka sequence.
- Try this: drag "Region" to Filters, open its filter and leave only Russia: 706 of July's 1,321 quakes were in Russia.
Query it live
https://earthquake.usgs.gov/fdsnws/event/1/query?format=geojson&starttime=2025-07-28&endtime=2025-08-04&minmagnitude=6&eventtype=earthquake&orderby=time-asc
- Key: none. At most 20,000 events per request; for live dashboards USGS asks to use its real-time feeds.
- Licence: public domain; credit "U.S. Geological Survey" is asked for.
import { earthquakesUrl, earthquakeRows } from "./sources.js";

const response = await (await fetch(earthquakesUrl({ start: "2025-07-28", end: "2025-08-04", minMagnitude: 6 }))).json();
const rows = earthquakeRows(response);
$quakes = Invoke-RestMethod 'https://earthquake.usgs.gov/fdsnws/event/1/query?format=geojson&starttime=2025-07-28&endtime=2025-08-04&minmagnitude=6&eventtype=earthquake&orderby=time-asc'
$quakes.features.Count
/** Every earthquake of magnitude 4.5 or more in 2025 (USGS ANSS Comprehensive Catalog). */
export const EARTHQUAKES = { start: "2025-01-01", end: "2026-01-01", minMagnitude: 4.5 };

/** The FDSN event query as GeoJSON; it returns at most 20,000 events per request. No key needed. */
export function earthquakesUrl({ start, end, minMagnitude } = EARTHQUAKES) {
    const q = new URLSearchParams({ format: "geojson", starttime: start, endtime: end, minmagnitude: String(minMagnitude), eventtype: "earthquake", orderby: "time-asc" });
    return `https://earthquake.usgs.gov/fdsnws/event/1/query?${q}`;
}

/**
 * The region of a USGS place name: the text after the last comma ("92 km S of Lakatoro, Vanuatu" is
 * "Vanuatu"), else all of it ("southern Mid-Atlantic Ridge"). A named event ("2025 Mandalay, Burma
 * (Myanmar) Earthquake") loses its year and "Earthquake".
 */
export function quakeRegion(place) {
    if (!place) return null;
    const i = place.lastIndexOf(",");
    return (i < 0 ? place : place.slice(i + 1)).replace(/^\s*\d{4}\s+/, "").replace(/\s+Earthquake\s*$/i, "").trim();
}

/** One row per earthquake from the response of `earthquakesUrl()`. */
export function earthquakeRows(response) {
    return response.features.map((f) => ({
        // an instant in UTC, to the second
        Time: new Date(f.properties.time).toISOString().slice(0, 19) + "Z",
        Magnitude: f.properties.mag,
        "Depth km": Math.round(f.geometry.coordinates[2] * 10) / 10,
        Place: f.properties.place,
        Region: quakeRegion(f.properties.place),
        Latitude: Math.round(f.geometry.coordinates[1] * 100) / 100,
        Longitude: Math.round(f.geometry.coordinates[0] * 100) / 100,
        // green, yellow, orange or red when USGS's PAGER estimated the impact, else blank
        Alert: f.properties.alert,
        // USGS sets it for large events in oceanic regions; it does not say that a tsunami happened
        "Tsunami flag": f.properties.tsunami === 1 ? "Yes" : "No"
    }));
}
Nobel laureates
Every Nobel Prize and every Prize in Economic Sciences from 1901 to 2026, one row per prize of a laureate (persons and organizations; a few won twice). "Country" is where a person was born or an organization founded, in today's borders as the source names them. "Share" is the laureate's portion of the prize.
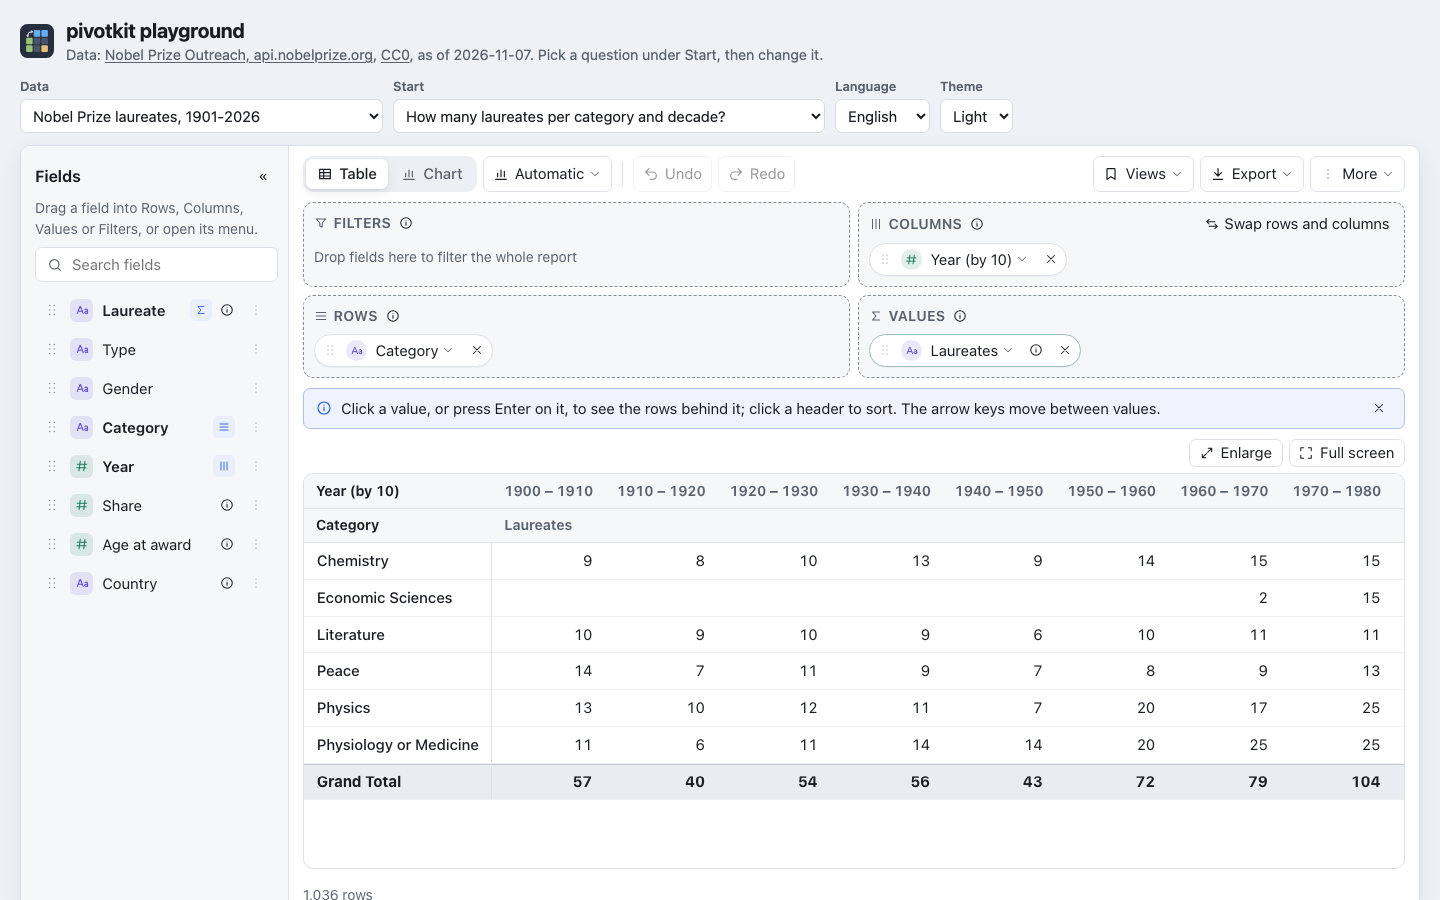
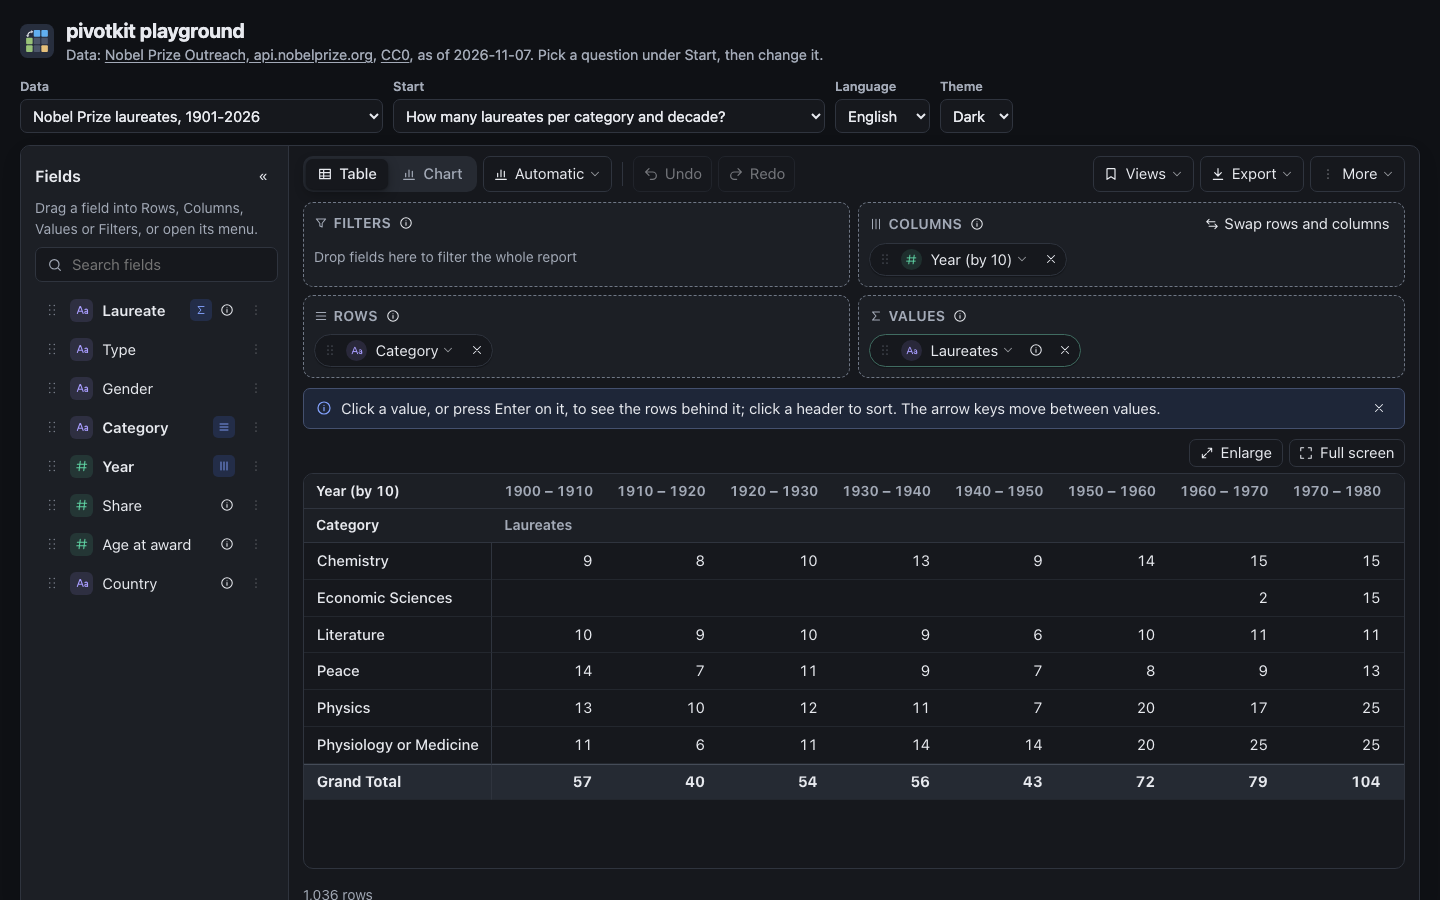
How many laureates per category and decade? Categories on rows, "Year" grouped in ranges of 10 on columns, the count of laureates.
- Read it: Physiology or Medicine has the most laureates (235), then Physics (231); Economic Sciences starts in 1969, so its first decade has 2.
- Try this: add "Share" to Values. Its sum is the number of prizes: a prize shared by three counts three laureates but one prize.
The same, decades down: swap rows and columns (chart) The template from above as stacked bars, the decades along the axis.
- Try this: click Swap rows and columns. The categories go along the axis, the decades become the stacks. Swap again to go back.
What share of laureates are women, per category? Categories on rows, gender on columns, counted as % of row total, filtered to persons.
- Read it: 7.0 % of all laureates are women; 18.6 % in Peace, 2.2 % in Physics.
- Try this: drag "Year" to Rows below "Category" and group it in ranges of 25 years: the share of women per category and quarter century.
Which countries have the most laureates? (top 10) Countries on rows, the count and the average age at the award, top 10.
- Read it: USA 309, United Kingdom 97, Germany 86; the laureates of these ten countries were 61 years old on average when they won.
- Try this: change the language in the header to Deutsch. Labels, numbers and the totals row ("Gesamtergebnis") follow; the data's own names stay as they are.
Query it live
https://api.nobelprize.org/2.1/laureates?offset=0&limit=5&sort=asc
- Key: none. No rate limit is documented; the terms ask to keep the load low and cache the data.
- Licence: CC0. The terms ask not to alter the data in a misleading way and not to use Nobel Prize Outreach's name or logo as an endorsement; naming the source is encouraged.
import { nobelUrl, nobelRows } from "./sources.js";

const page = await (await fetch(nobelUrl(0, 5))).json();   // page.meta.count: all laureates
const rows = nobelRows(page.laureates);
$nobel = Invoke-RestMethod 'https://api.nobelprize.org/2.1/laureates?offset=0&limit=5&sort=asc'
$nobel.meta.count
/** Every Nobel Prize laureate, persons and organizations, to the prizes of 2026 (Nobel Prize API 2.1). */
export const NOBEL = { pageSize: 1000 };

/** One page of laureates; the response's `meta.count` tells how many there are. No key needed. */
export function nobelUrl(offset = 0, limit = NOBEL.pageSize) {
    return `https://api.nobelprize.org/2.1/laureates?offset=${offset}&limit=${limit}&sort=asc`;
}

/** One row per prize of a laureate (a few laureates won twice) from the `laureates` of every page. */
export function nobelRows(laureates) {
    const rows = [];
    for (const l of laureates) {
        const person = Boolean(l.knownName);
        const name = person ? l.knownName.en : l.orgName.en;
        const born = person ? l.birth?.year : l.founded?.date?.slice(0, 4);
        const country = person ? l.birth?.place?.countryNow?.en : l.founded?.place?.countryNow?.en;
        for (const p of l.nobelPrizes ?? []) {
            const [num, den] = String(p.portion ?? "1").split("/").map(Number);
            rows.push({
                Laureate: name,
                Type: person ? "Person" : "Organization",
                Gender: person && l.gender ? l.gender[0].toUpperCase() + l.gender.slice(1) : null,
                Category: p.category.en,
                Year: Number(p.awardYear),
                // a prize shared by three is 1/3 each; the shares of one prize add up to 1
                Share: num / (den || 1),
                "Age at award": person && born ? Number(p.awardYear) - Number(born) : null,
                // where a person was born or an organization founded, in today's borders
                Country: country ?? null
            });
        }
    }
    return rows.sort((a, b) => a.Year - b.Year || a.Category.localeCompare(b.Category, "en") || a.Laureate.localeCompare(b.Laureate, "en"));
}
Software end of life
Every release cycle of every product on endoflife.date: operating systems, languages, databases, frameworks, server and desktop apps, cloud services and devices. A row is one release cycle ("Python 3.12", "Ubuntu 24.04"). "EOL" and "Maintained" are Yes or No as endoflife.date saw them on 2026-11-07; "Maintained" stays Yes while any support is left, extended support included. "Days to EOL" counts from that day (negative: the end lies behind), "Support years" from the release to the end of life. 1,288 cycles have no known end of life: their "EOL date", "Support years" and "Days to EOL" are blank, and 551 of them are EOL all the same, the date was just never recorded.
How many release cycles reach end of life per year? (chart) "EOL date" grouped by year (the derived field "EOL date by year"), counted, filtered to 2016 to 2030, as bars.
- Read it: 2026 has the most, 1,047 release cycles; 2025 follows with 1,008. The later years are not complete: 737 supported cycles have no end date yet.
- Try this: add "Category" to Columns and pick Chart type: Heatmap. Server apps stand out: 487 of 2026's cycles.
Which products have the most supported release cycles right now? (top 10) Products on rows, filtered to "Maintained" Yes and to the top 10 by count; the oldest release date still supported next to it.
- Read it: devices and services lead: Samsung Mobile 127, Motorola Mobility 103, OpenAI API Models
- A phone model is a release cycle here.
- Try this: open the menu of "Product", set Count under Top to 20 and press Apply.
How long is a release supported, by category? (ranges of 2 years) Categories on rows, "Support years" in ranges of 2 on columns, counted as % of row total; cycles without a known end are filtered out (the "(blank)" item of the range).
- Read it: 61.0 % of all release cycles with a known end are supported for less than 2 years; of the devices only 5.1 %.
- Try this: open the menu of "Support years (by 2)" and set Range size to 5.
Are LTS releases supported longer? (average years) Categories on rows, "LTS" (Yes or No) on columns, the average of "Support years".
- Read it: 3.4 years with LTS against 2.1 without. Languages differ most: 6.3 years against 1.8.
- Try this: open the menu of "Average of Support years", open More statistics and pick Median. Languages without LTS drop to 0.6 years (0.55, shown with the one decimal the data set sets for "Support years"): many short-lived cycles, a few long ones pull the average up.
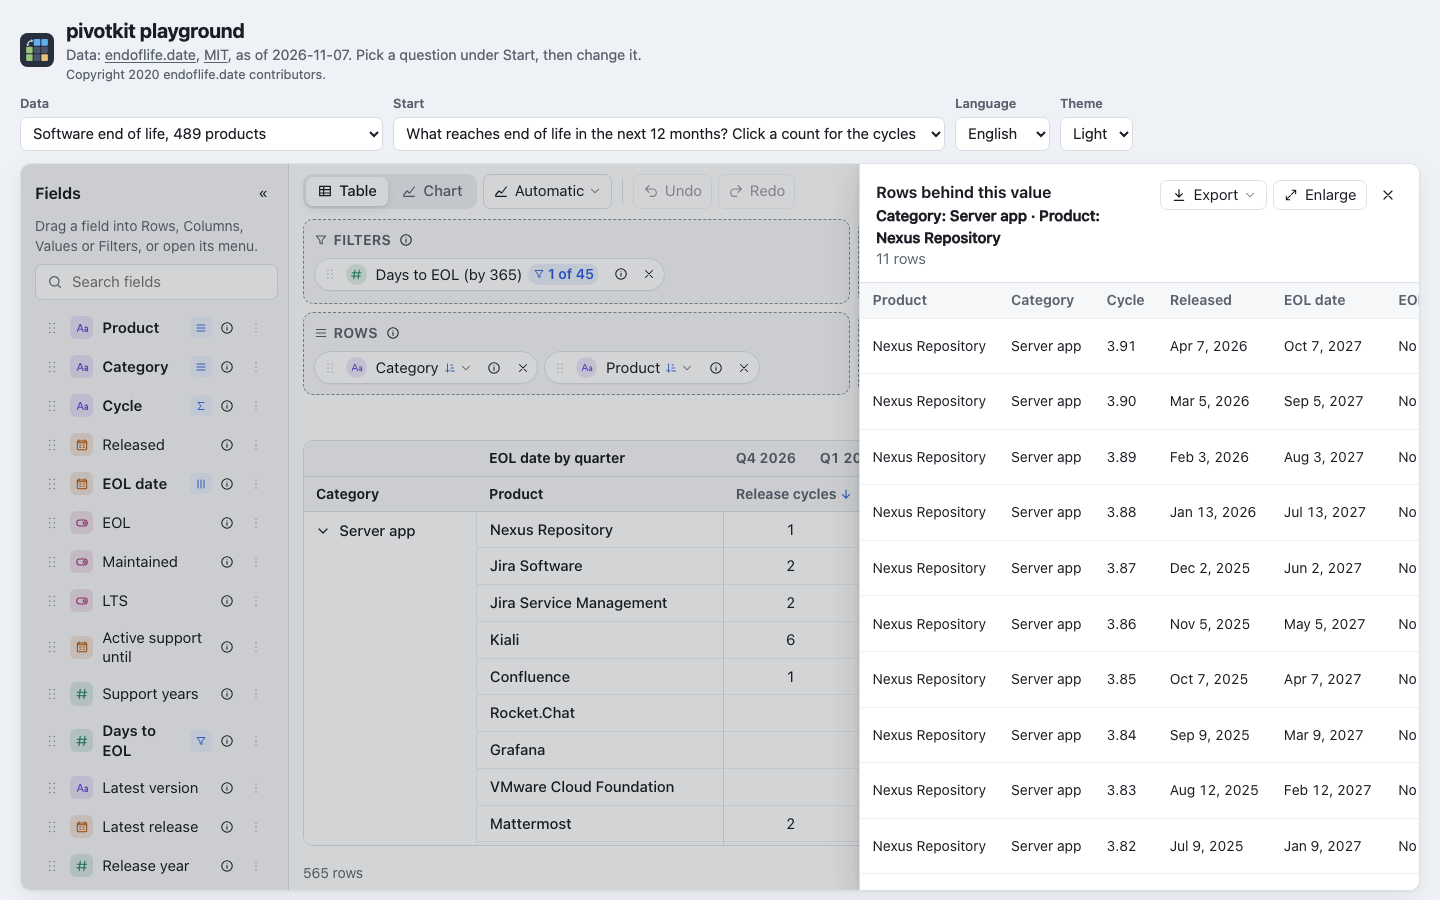
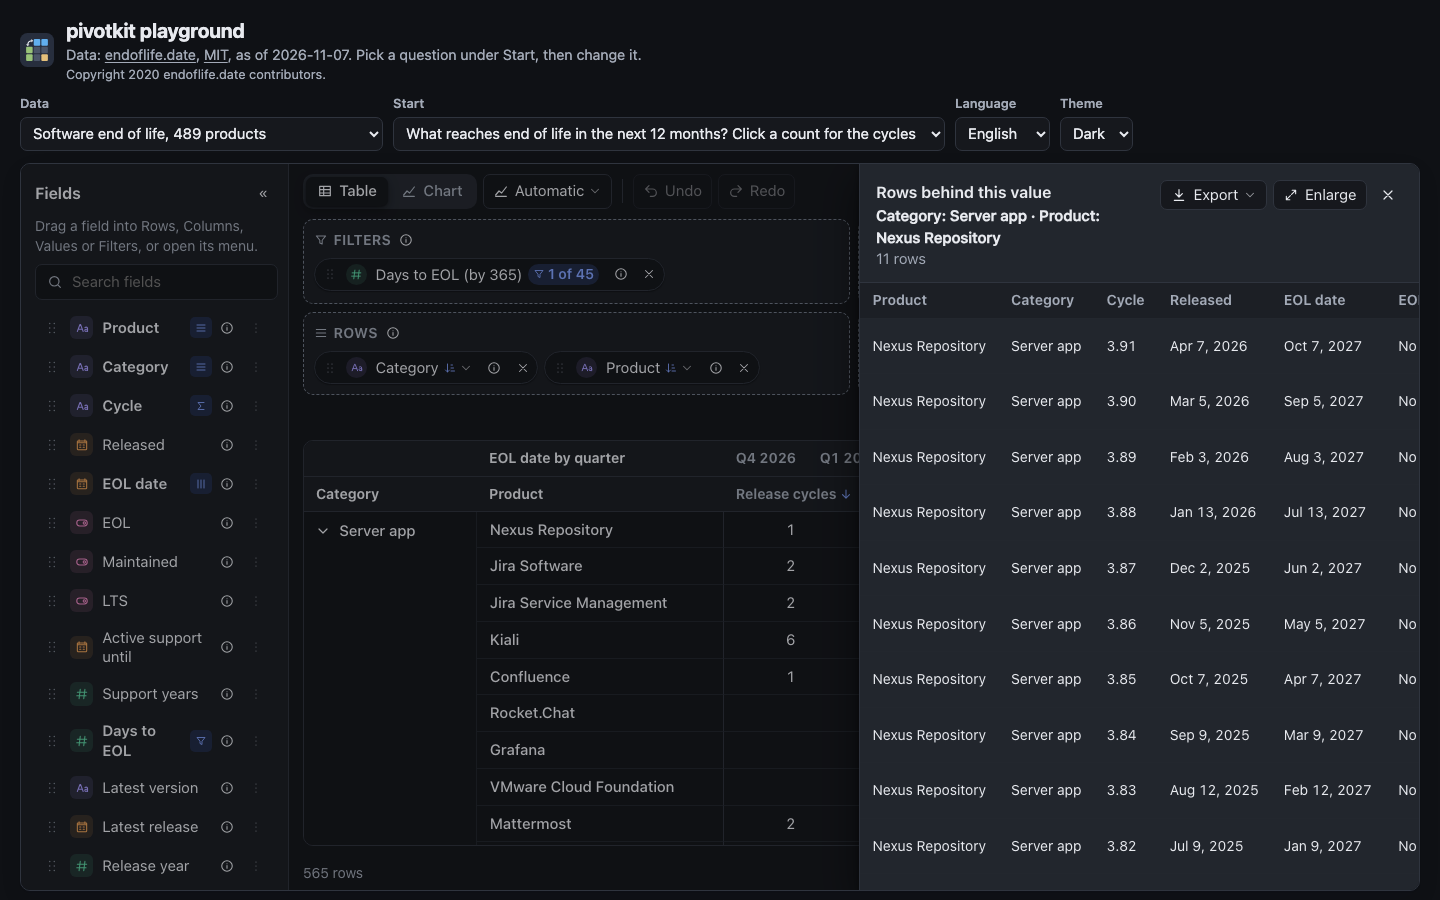
What reaches end of life in the next 12 months? Click a count for the cycles Category and product on rows, the quarter of the EOL date on columns, filtered with "Days to EOL" in ranges of 365 to the range 0 to 365.
- Read it: 565 release cycles end within a year of the snapshot; server apps have the most (193). The last column is a partial quarter: the year ends on 6 November 2027.
- Try this: click a product's total. A panel lists its cycles with release date, EOL date and latest version. Press Escape to close it.
Query it live
https://endoflife.date/api/v1/products/python
https://endoflife.date/api/v1/products/full
- Key: none. No rate limit is documented; the API answers
429 Too Many Requestswith aRetry-Afterheader when a client asks too often, and supports304 Not Modifiedfor caching (API documentation). The API is marked beta. products/fullreturns every product with every release cycle in one response (about 3 MB),products/{product}one product.- Licence: MIT. Keep the copyright notice "Copyright 2020 endoflife.date contributors" and the licence text with copies of the data; the playground shows the notice and links the licence.
import { endoflifeRows } from "./sources.js";

const response = await (await fetch("https://endoflife.date/api/v1/products/python")).json();
// one product: its result is the product, not a list
const rows = endoflifeRows({ ...response, result: [response.result] });
$eol = Invoke-RestMethod 'https://endoflife.date/api/v1/products/python'
$eol.result.releases | Select-Object name, releaseDate, eolFrom, isEol, isLts
eolFrom is a date or empty (not known), isEol always True or False; the dates stay text.
/** Every release cycle of every product on endoflife.date: release, support and end-of-life dates. */
export const ENDOFLIFE = {
    // the API's category slugs as labels; a category added later keeps its slug
    categories: {
        app: "App",
        database: "Database",
        device: "Device",
        framework: "Framework",
        lang: "Language",
        os: "Operating system",
        "server-app": "Server app",
        service: "Service",
        standard: "Standard"
    }
};

/** All products with all their release cycles in one response (about 3 MB). No key needed. */
export const endoflifeUrl = "https://endoflife.date/api/v1/products/full";

/** Whole days from the date `from` to the date `to` ("YYYY-MM-DD", read as UTC: no time zone shift). */
export function daysBetween(from, to) {
    return Math.round((Date.parse(to) - Date.parse(from)) / 86_400_000);
}

/**
 * One row per release cycle from the response of `endoflifeUrl`. The API decides "EOL" and
 * "Maintained" on the day it generated the response (`generated_at`); "Days to EOL" counts from that
 * day too, so the three agree. A date the API does not know is null, never a boolean.
 */
export function endoflifeRows(response) {
    const asOf = response.generated_at.slice(0, 10);
    const rows = [];
    for (const p of response.result) {
        for (const r of p.releases) {
            // eolFrom is a date or null (not known); isEol is always a boolean
            const eol = r.eolFrom ?? null;
            rows.push({
                Product: p.label,
                Category: ENDOFLIFE.categories[p.category] ?? p.category,
                Cycle: r.name,
                Released: r.releaseDate,
                "EOL date": eol,
                EOL: r.isEol,
                // any support left, extended support included
                Maintained: r.isMaintained,
                LTS: r.isLts,
                // the end of active support: not provided for products without that phase, null when unknown
                "Active support until": r.eoasFrom ?? null,
                // from the release to its end of life in years of 365.25 days (1,461 days are 4 years), cut, not
                // rounded, to 0.01 so that a range of whole years holds exactly its cycles; blank without an end
                "Support years": eol === null ? null : Math.floor((daysBetween(r.releaseDate, eol) * 400) / 1461) / 100,
                // negative: the end of life lies that many days back
                "Days to EOL": eol === null ? null : daysBetween(asOf, eol),
                "Latest version": r.latest?.name ?? null,
                "Latest release": r.latest?.date ?? null,
                "Release year": Number(r.releaseDate.slice(0, 4)),
                // last: long, and only useful to search or filter by
                Tags: p.tags.length ? p.tags.join(", ") : null
            });
        }
    }
    return rows.sort((a, b) => a.Product.localeCompare(b.Product, "en") || b.Released.localeCompare(a.Released) || a.Cycle.localeCompare(b.Cycle, "en"));
}
The examples were run against the live services on 2026-11-07 (PowerShell 7.6). All five services
send Access-Control-Allow-Origin: *, so fetch works from a page in the browser too.