Quick start
You build a report by putting fields into four boxes, the zones: Rows and Columns split the table, Values says what is computed in its cells, Filters leaves rows out. These six steps build "revenue per region and category" from sales data. Follow along in the live demo (Data: Sales, Start: Empty report) or in your own application.
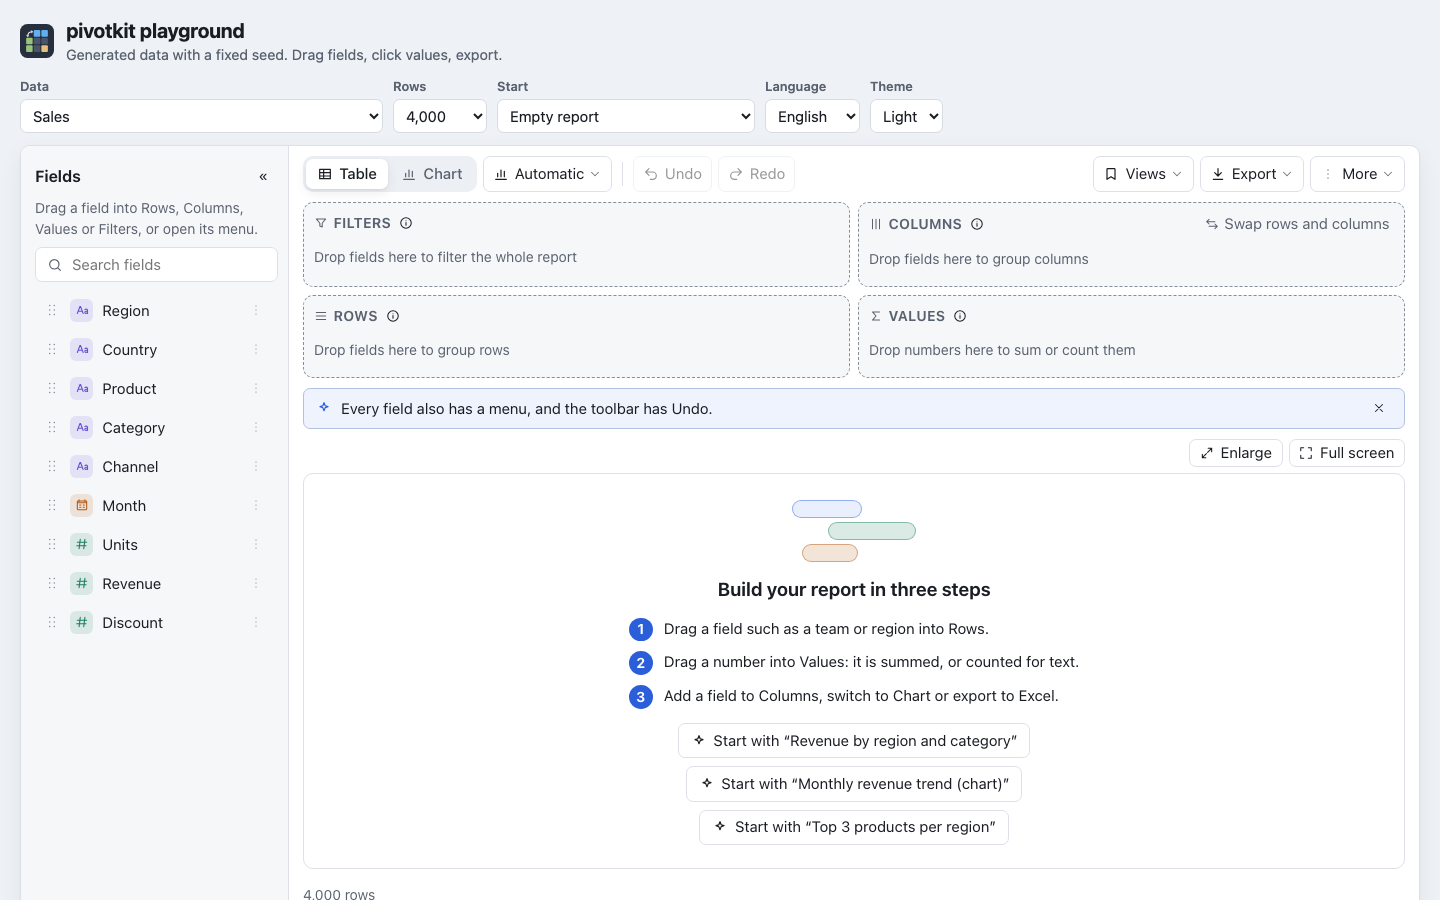
1. Open the report
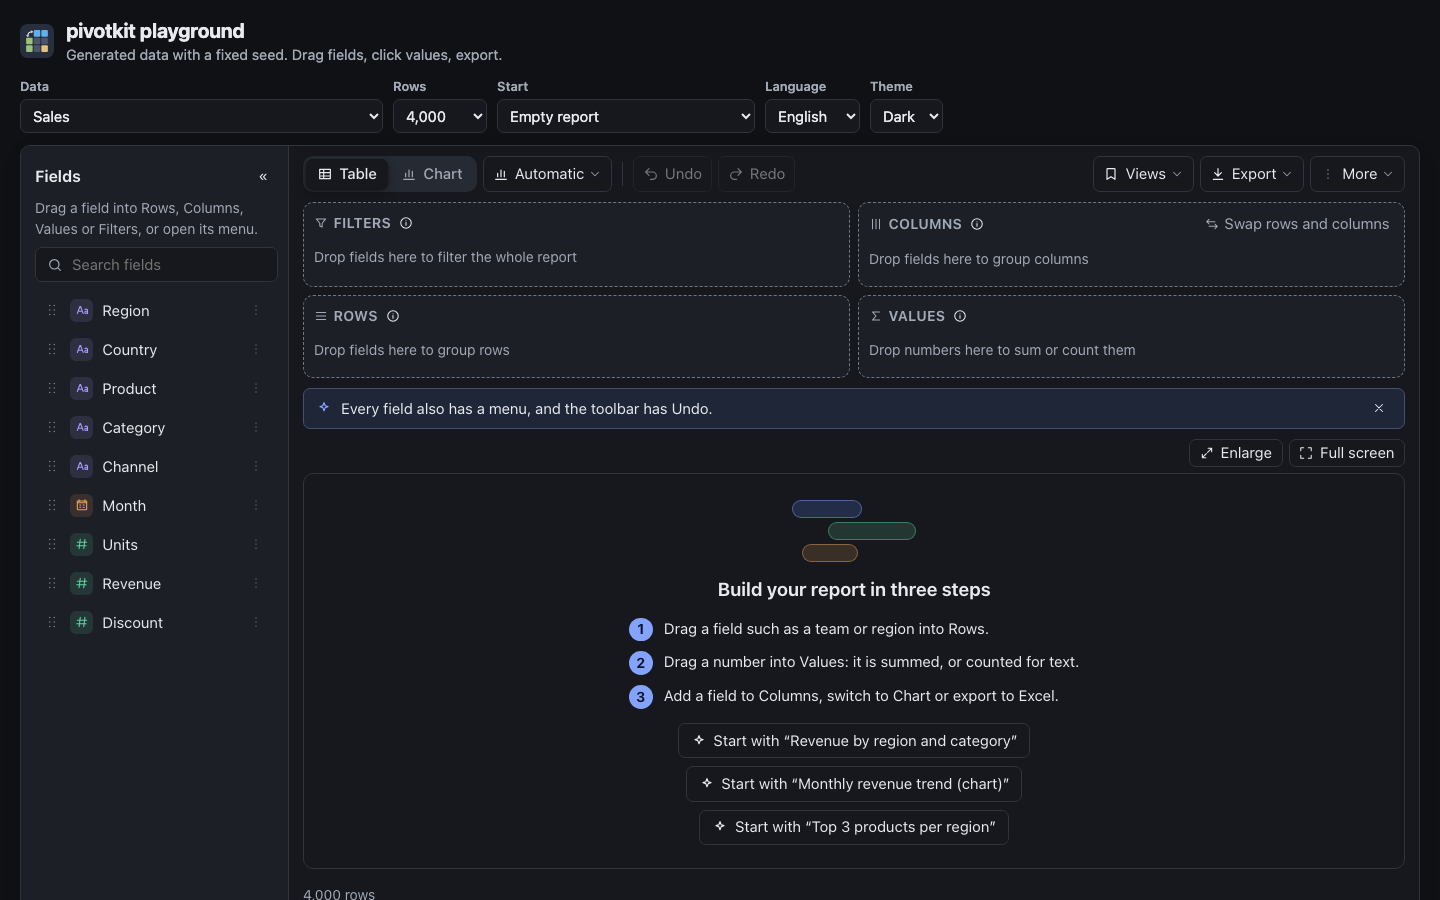
An empty report lists every field of the data on the left and shows three first steps in the middle, with up to three saved views to start from instead.
2. Put a field into Rows
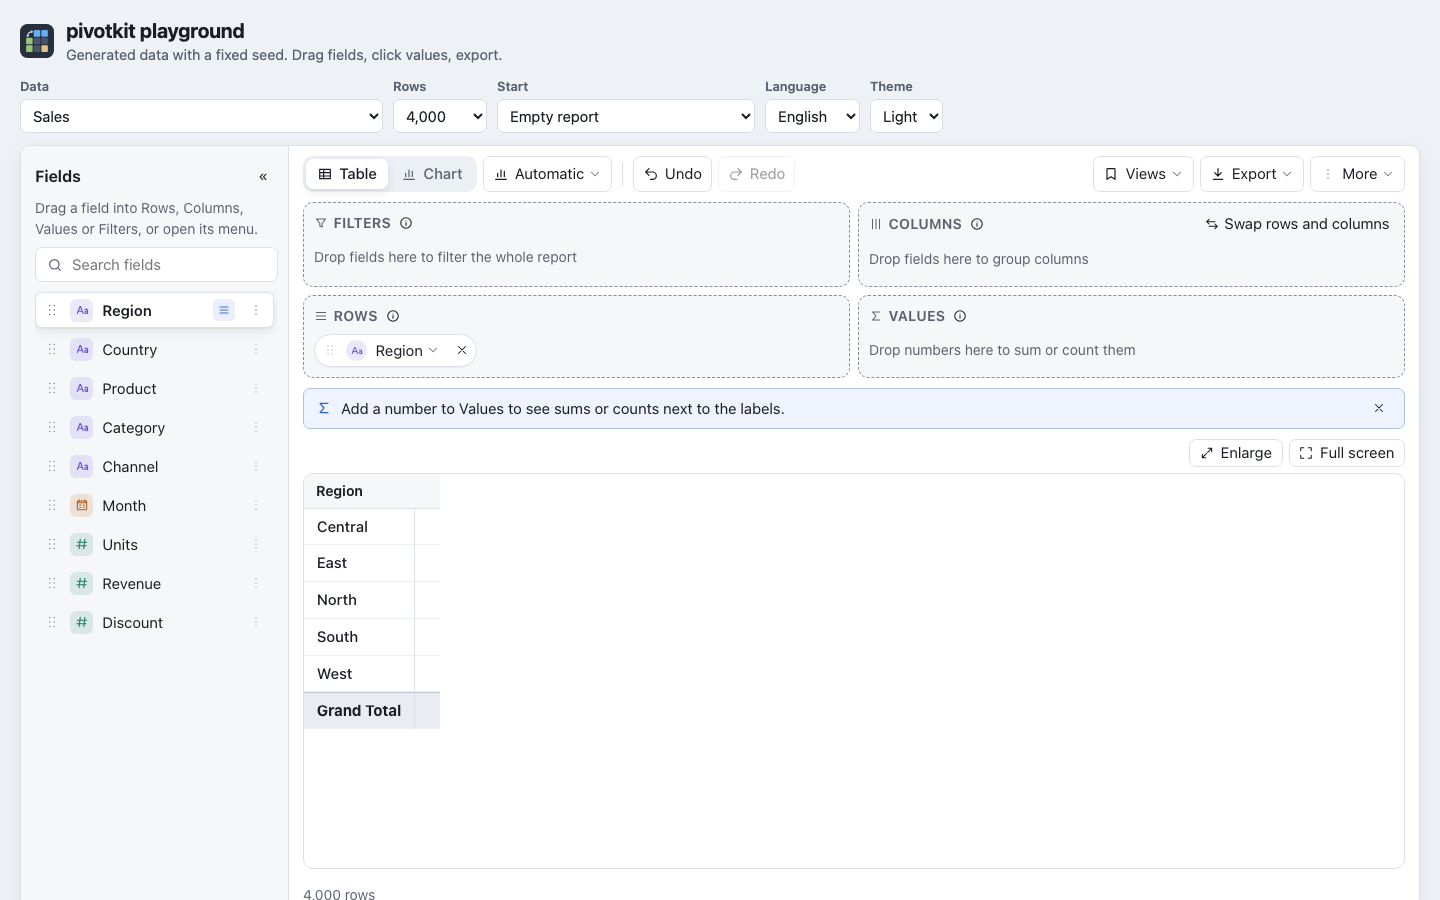
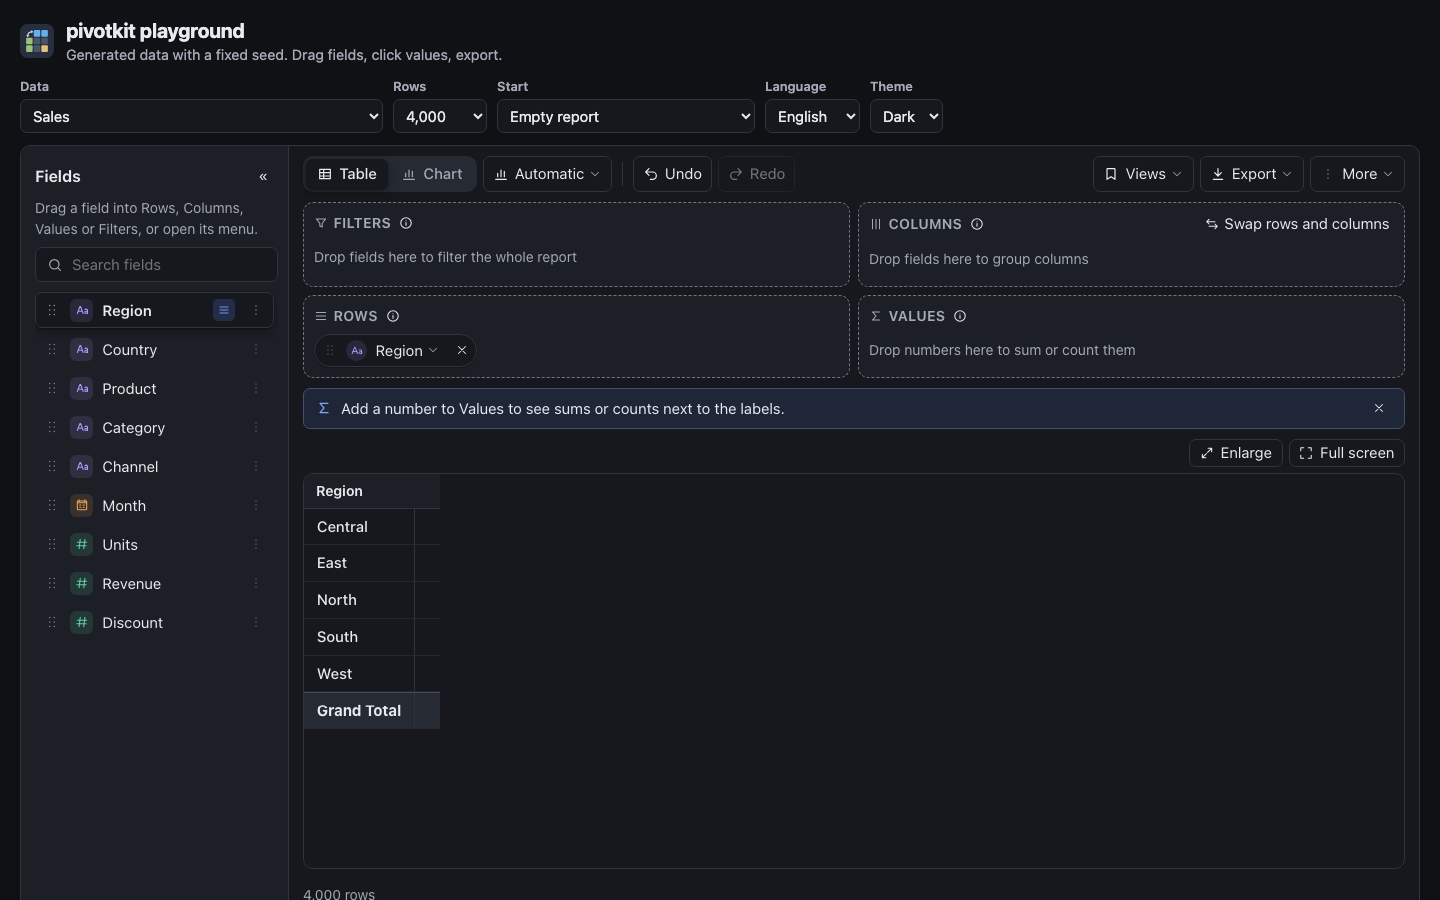
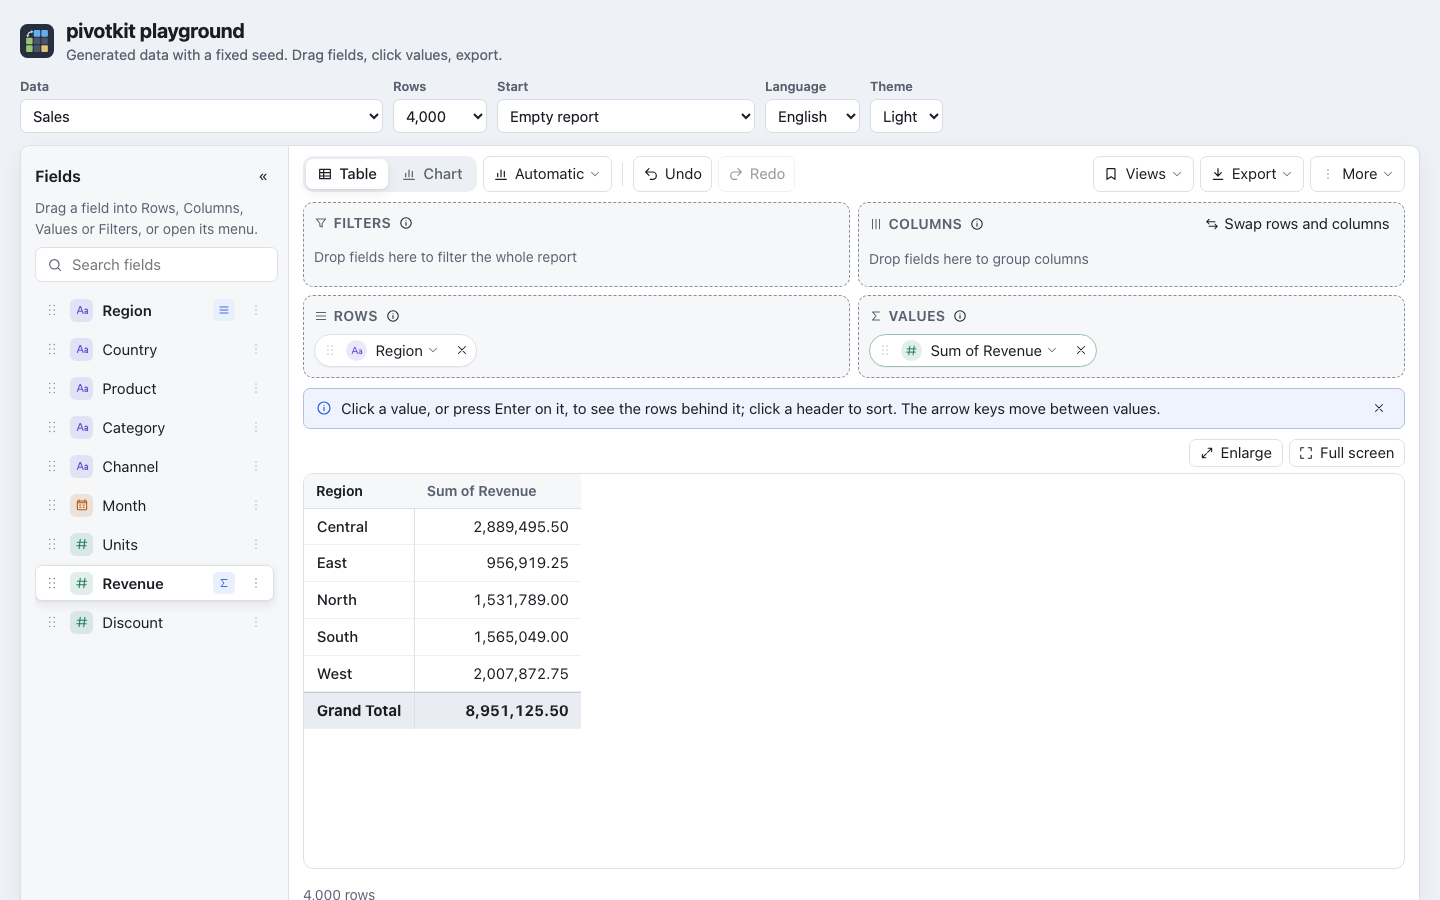
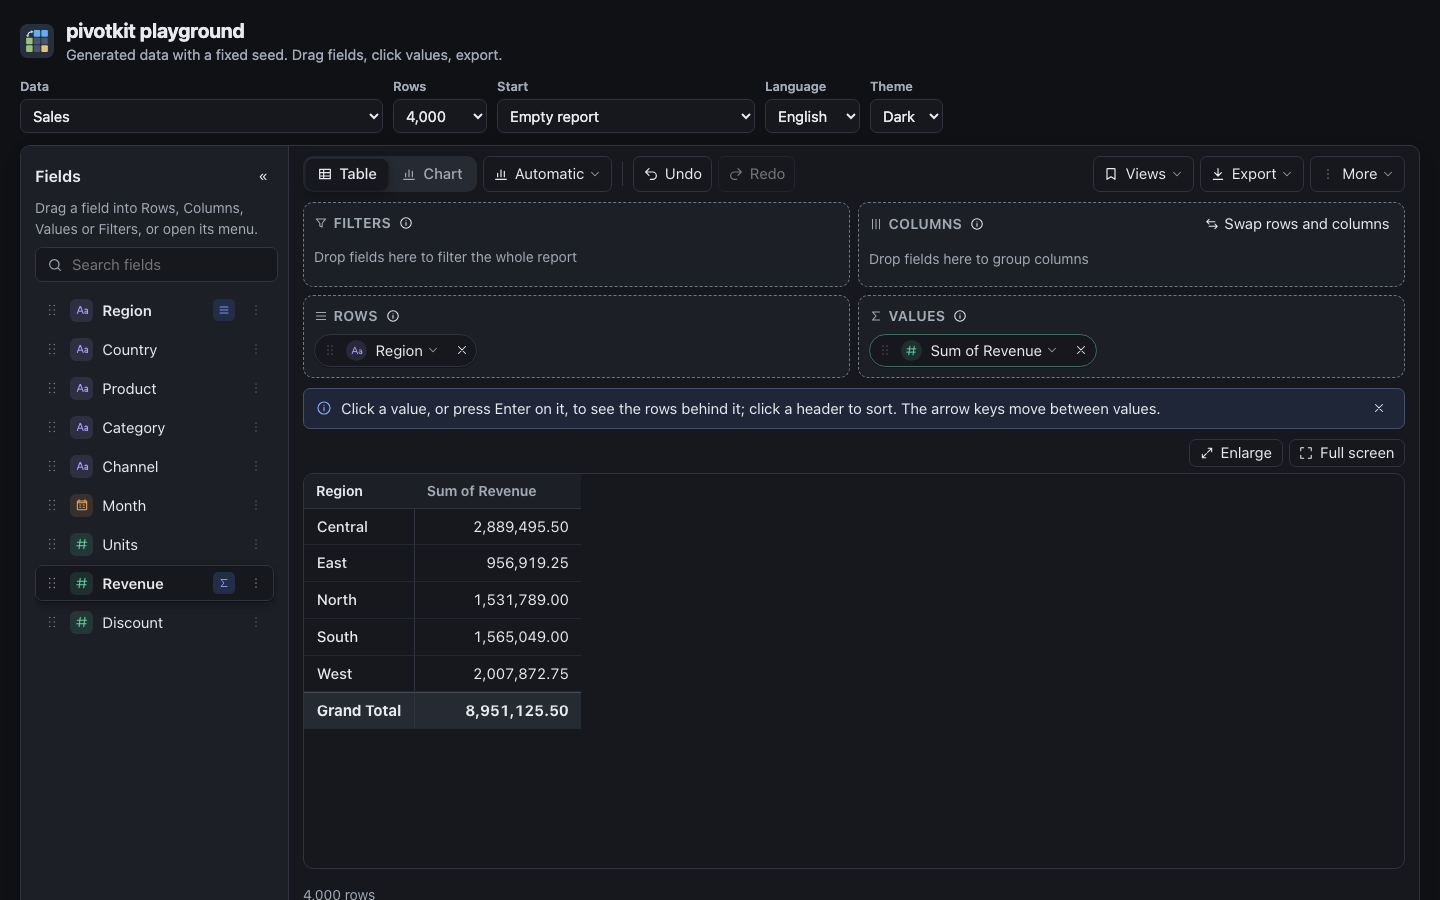
Drag Region from the field list into Rows, or click it: a text field goes to Rows. The table gets one row per region and a grand total row; a tip says what comes next.
3. Put a number into Values
Drag Revenue into Values, or click it: a number goes to Values and is summed. The column reads "Sum of Revenue"; its menu (the arrow on the chip) changes the sum to an average or a count, and the number format. A tip says that a click on a value shows the rows behind it.
4. Split the columns
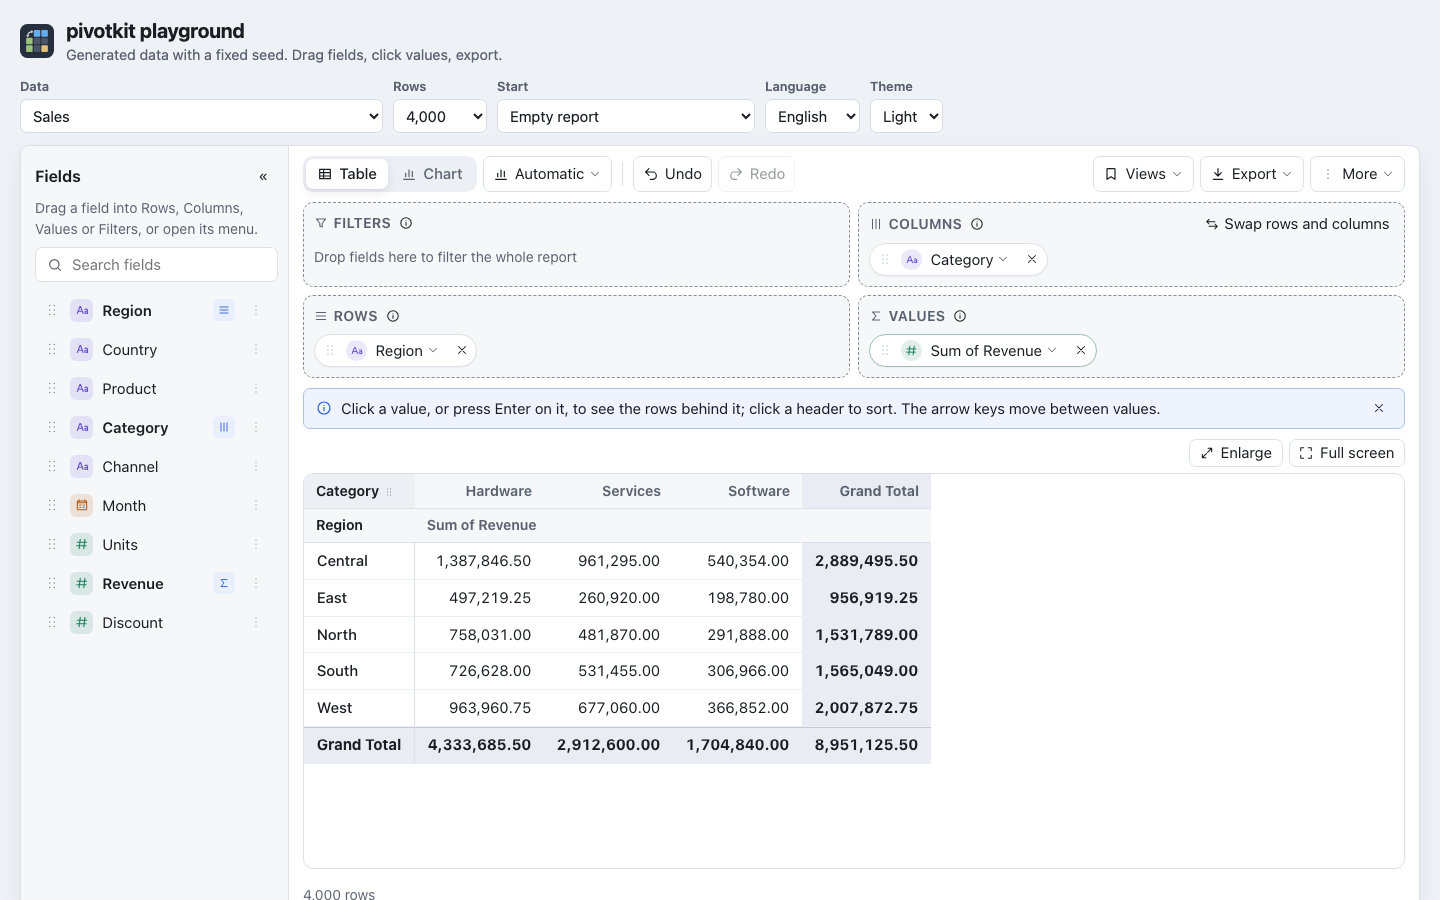
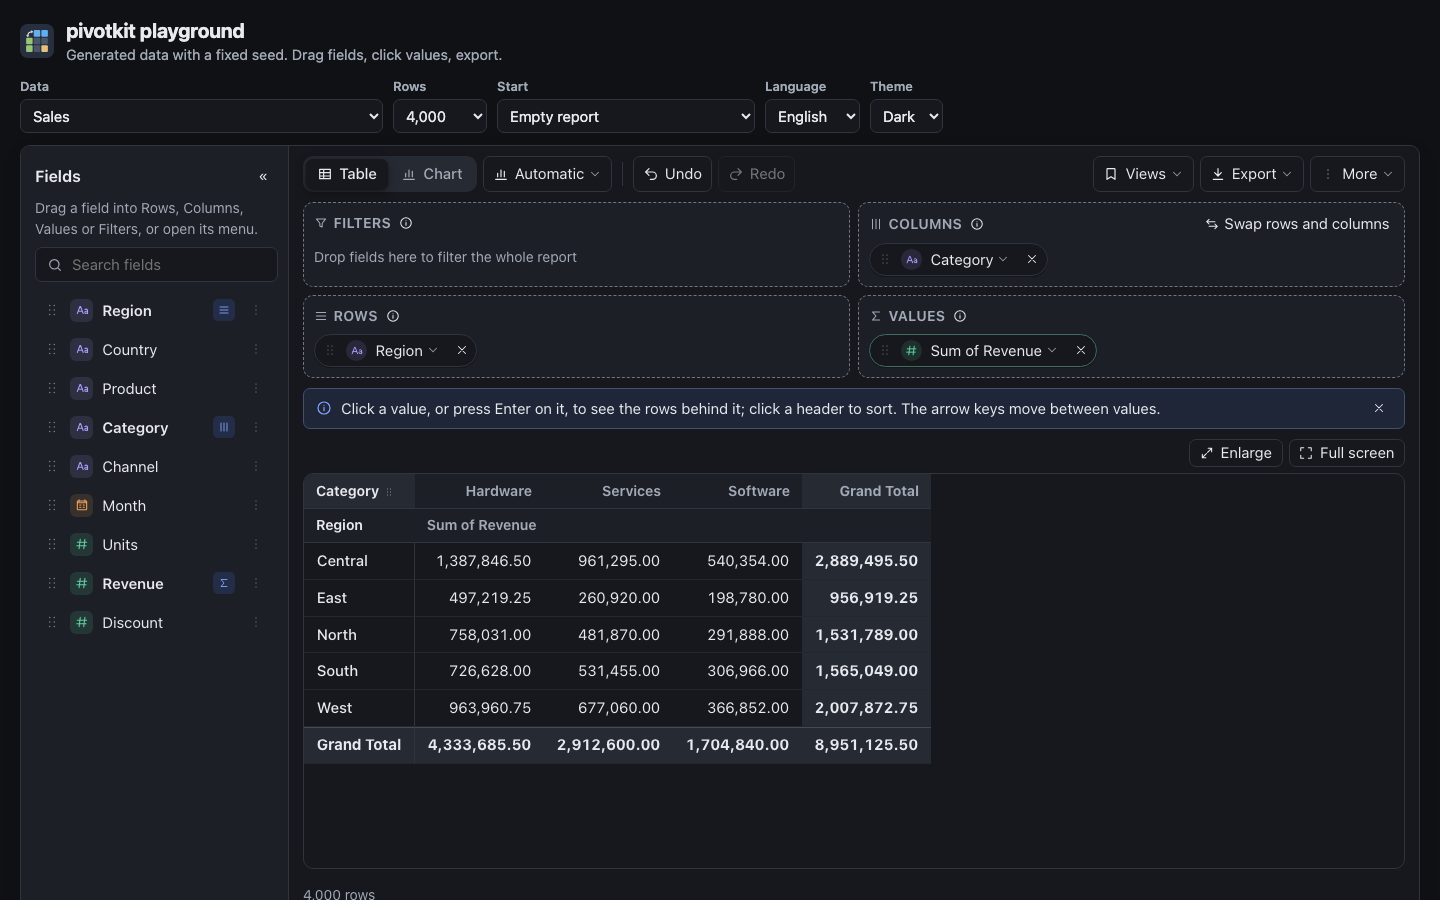
Drag Category into Columns, or choose "Add to Columns" in its menu (the three dots next to the field). Each region now has a value per category, with totals at the right and at the bottom.
5. Filter
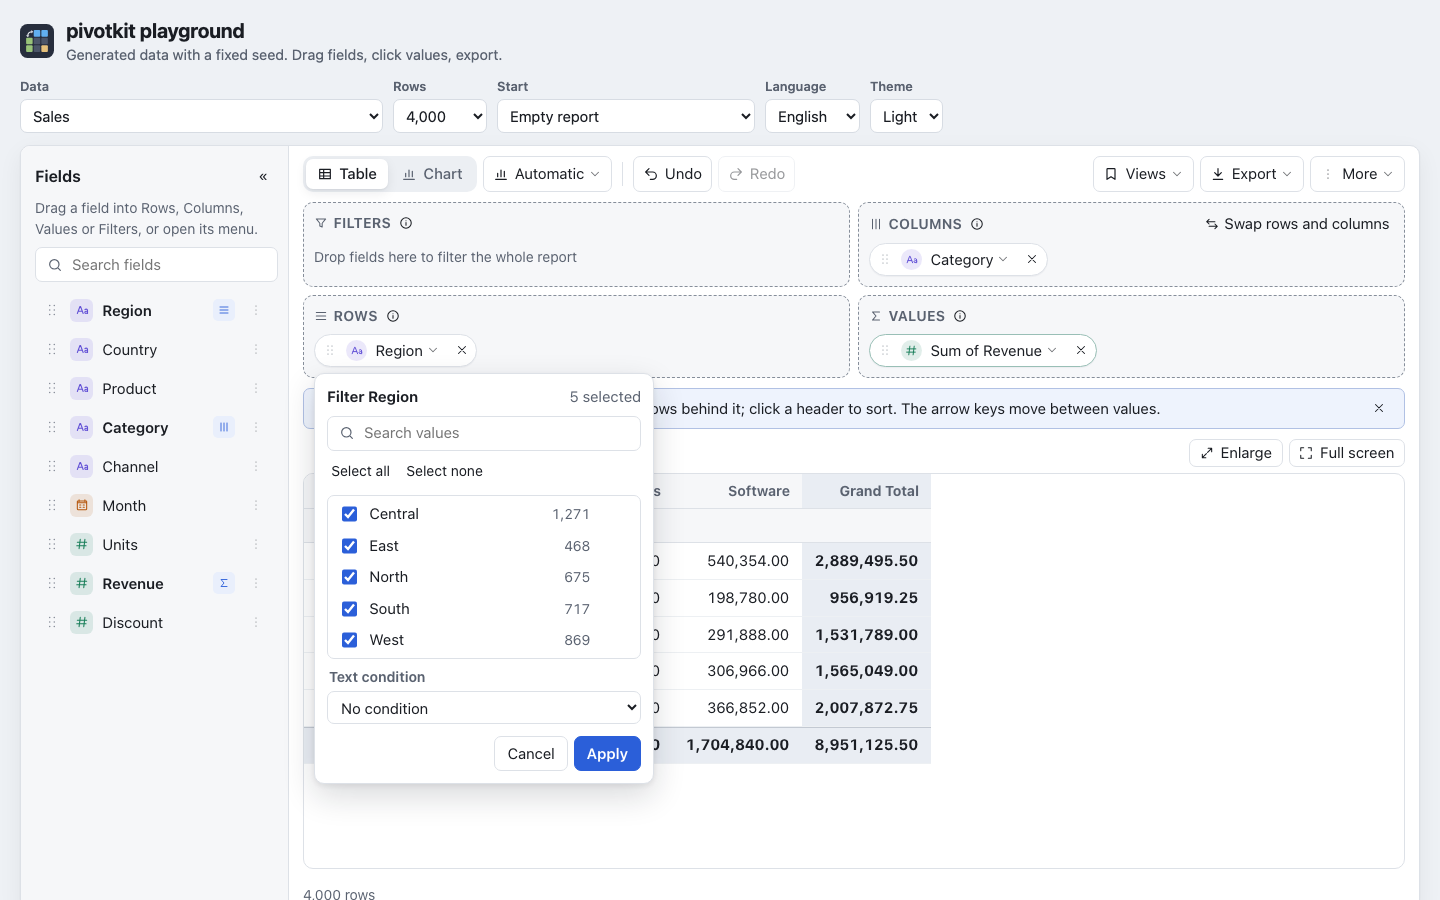
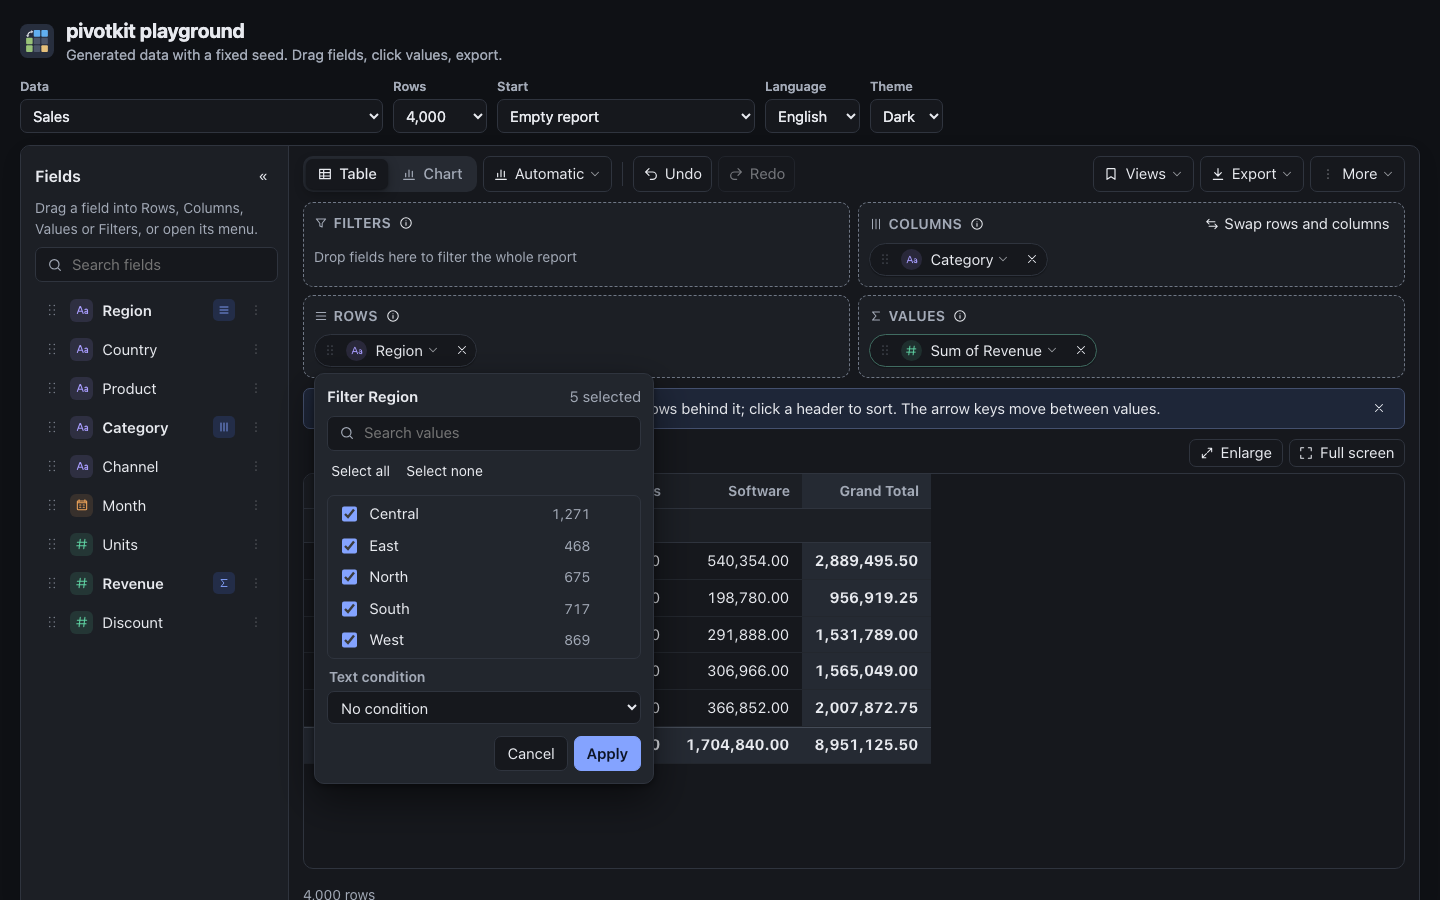
Open the menu of the Region chip and choose the filter. Untick the regions you do not want, or click Only next to one, then Apply. The chip then says how many it keeps ("3 of 5").
6. Switch to the chart
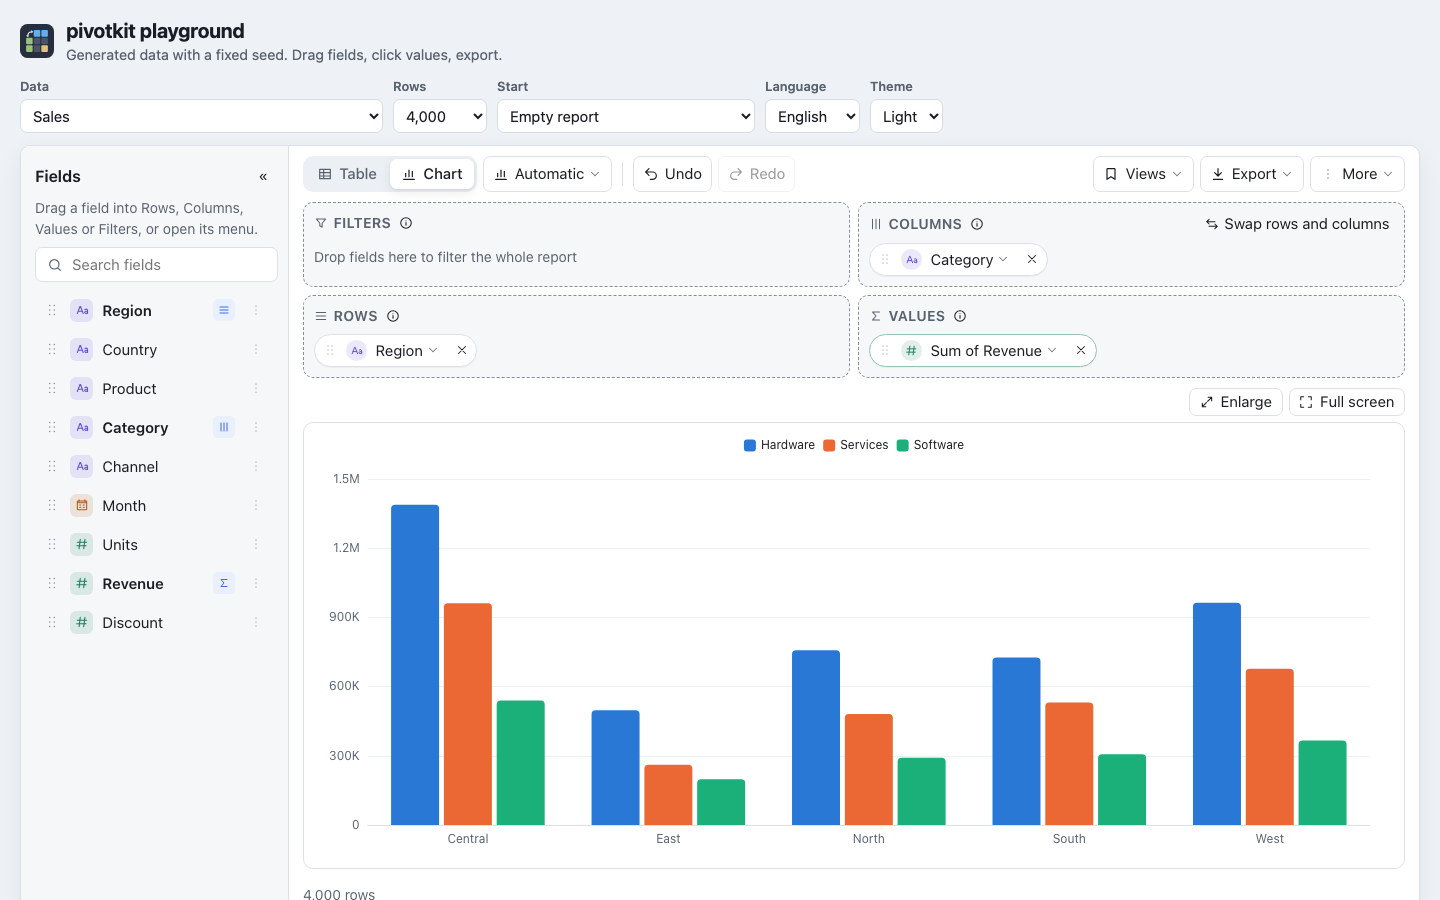
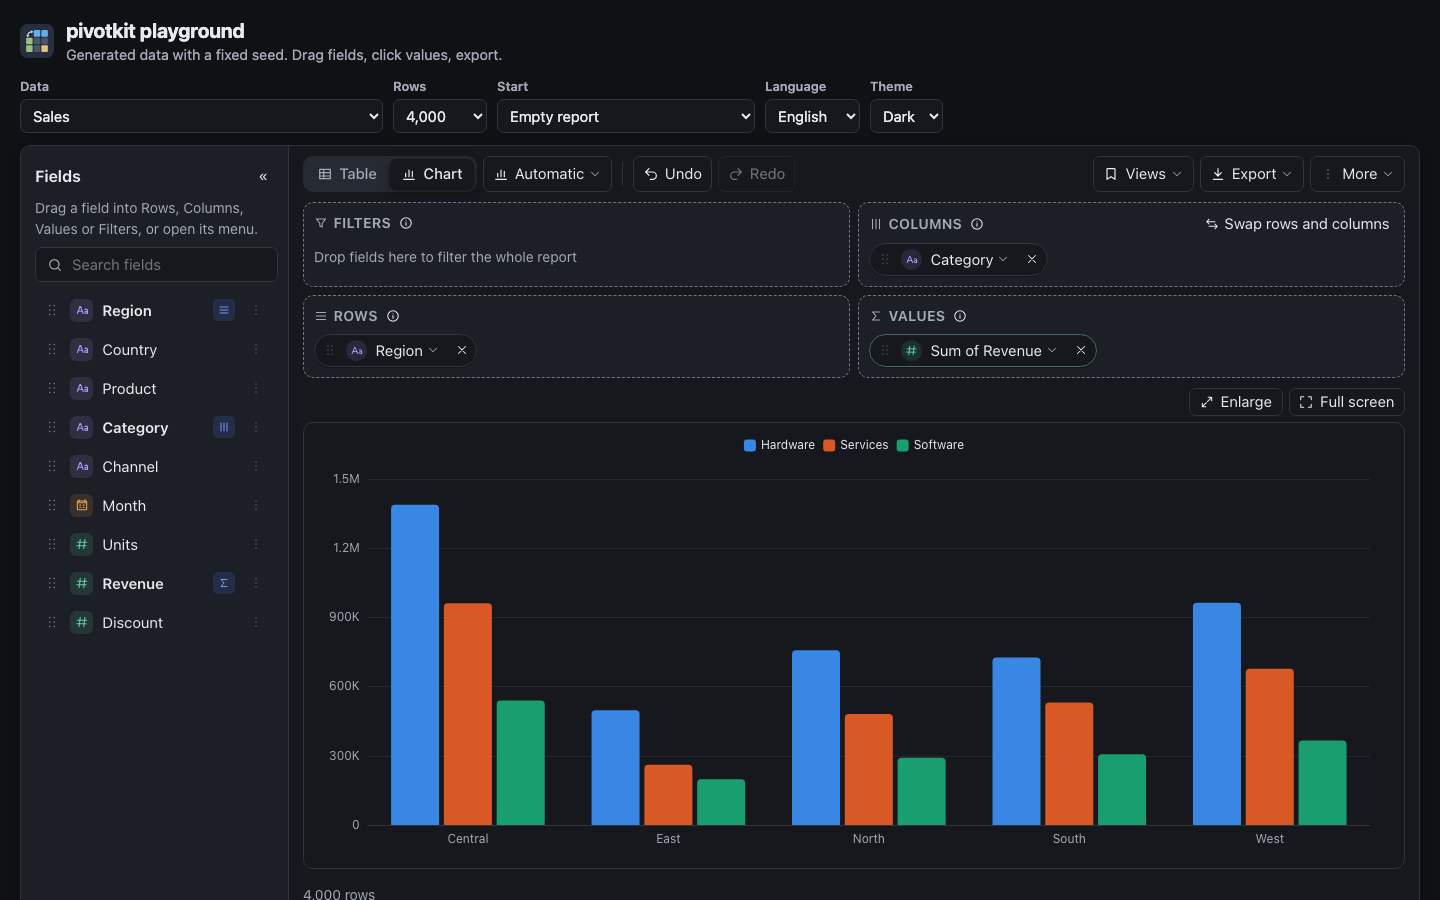
Click Chart in the toolbar. The same report is drawn as bars, one colour per category. Table brings the table back.
Then: save, share or export
- Undo takes back any step; Reset goes back to the start; New starts an empty report.
- Views, Save current view keeps the report under a name, for you; once you work on a saved view, Save writes your changes into it with one click. Share copies a link or downloads it as a file (Views, saving and sharing).
- Export downloads the table as Excel or CSV, or the chart as a picture, and copies the table into a spreadsheet (Export and copy).
- Click any number to see the rows behind it (The rows behind a number).
Next: Learn with real data has questions to answer on real public data, and Use a report lists a page for every task.