Fields, zones and the table
You build a report by putting the fields of your data into four zones. Rows and Columns say how the table is split, Values what is computed in its cells, Filters what is left out of the whole report. A field in a zone is a chip; its menu changes how it is shown.
The parts
| Part | Where | What it does |
|---|---|---|
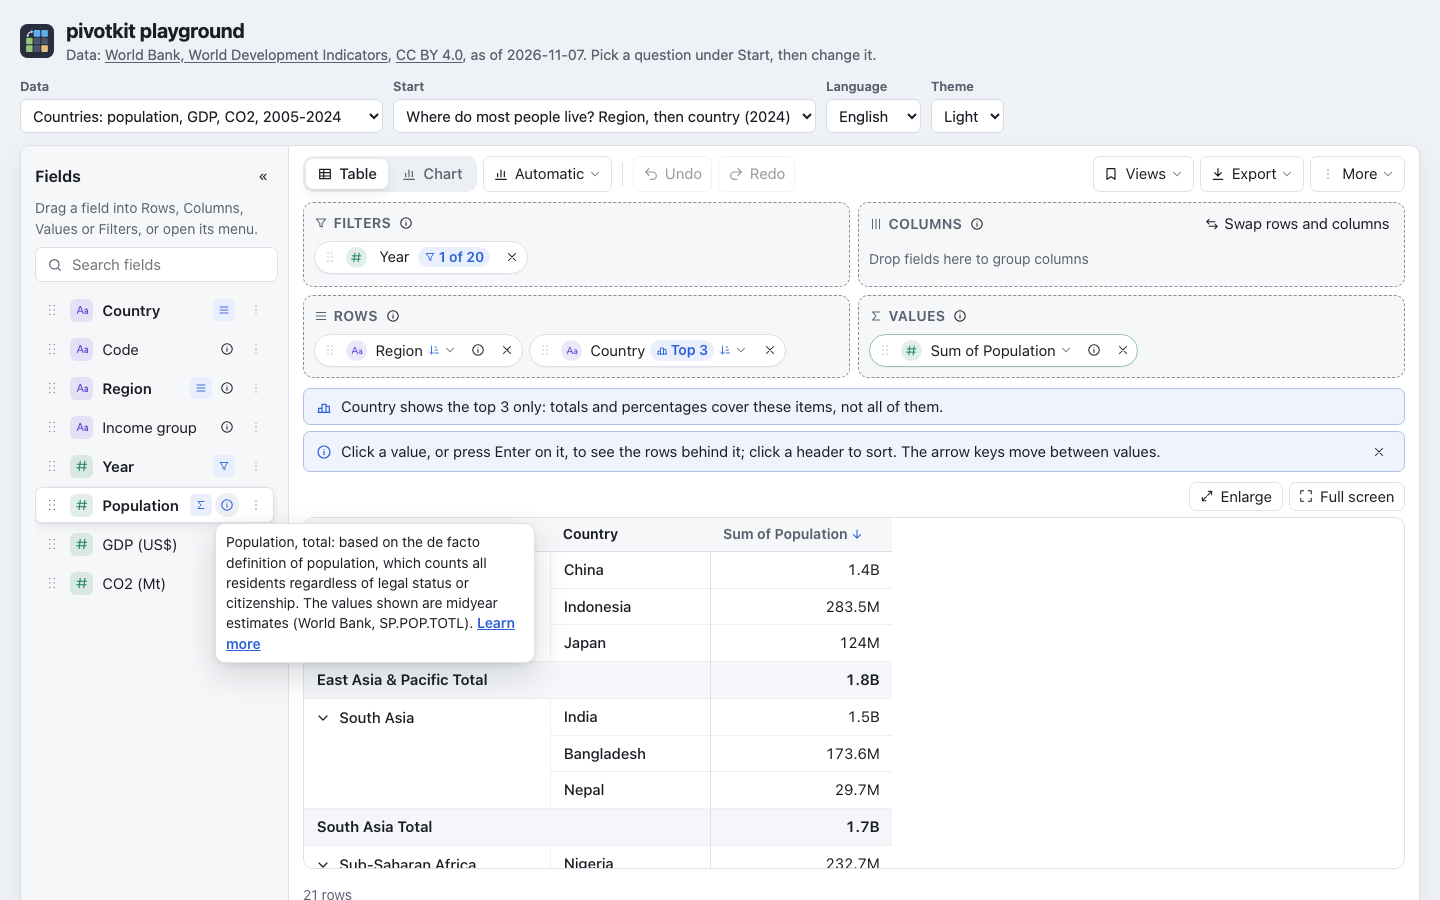
| Fields | left | Every column of the data, with an icon for its type (text, number, date, yes/no) and a search. A mark next to a field shows which zone it is in. When the application describes a field, an i next to it says what the field means. A long field name takes two lines, with the whole name when you point at it. |
| The zones | top | Rows, Columns, Values and Filters. The i next to a zone's title says what it does, with an example; Options, Help, Show explanations switches these off and on. |
| The toolbar | above the zones | Table or Chart, the chart type, Undo, Redo, Reset, Layout, Options, the name of the view you loaded, Views and Export. What does not fit moves into More (small screens). |
| The result | below | The table or the chart, with tips above it, Enlarge and Full screen at its top right, and a status line below it. |
Adding fields
| To put a field into a zone | How |
|---|---|
| Drag | Drag the field into a zone. The lists and the page scroll while you drag, and the field you drag is drawn above everything. |
| Click | Click the field, or press Enter on it: numbers go to Values, everything else to Rows. |
| Menu | Open the field's menu (the three dots, or a click on the grip left of the field, which says "Drag into a zone") and choose Add to Rows, Columns, Values or Filters. |
All three give the same result. Details:
- A click on a field in Columns or Filters moves it to Rows. A field that is in that zone already stays, and the status line says so ("Region is already in Rows", "Revenue is already in Values"), so a second click or Enter never adds it twice.
- For a field in Values already the menu entry reads Add to Values again: it adds a second value of the field (a second "Sum of Revenue", to show it as a share, say).
- A field that is not in the report yet also has Filter… in its menu: see Filters.
- An empty report shows three first steps and up to three saved views to start from.
- A date is grouped as soon as it is placed, by the span of its values: up to 62 days by day, up to two years by month ("Jan 2025"), up to six years by quarter, longer by year. The chip says so: "Created by month" (dates and number ranges).
What a field means
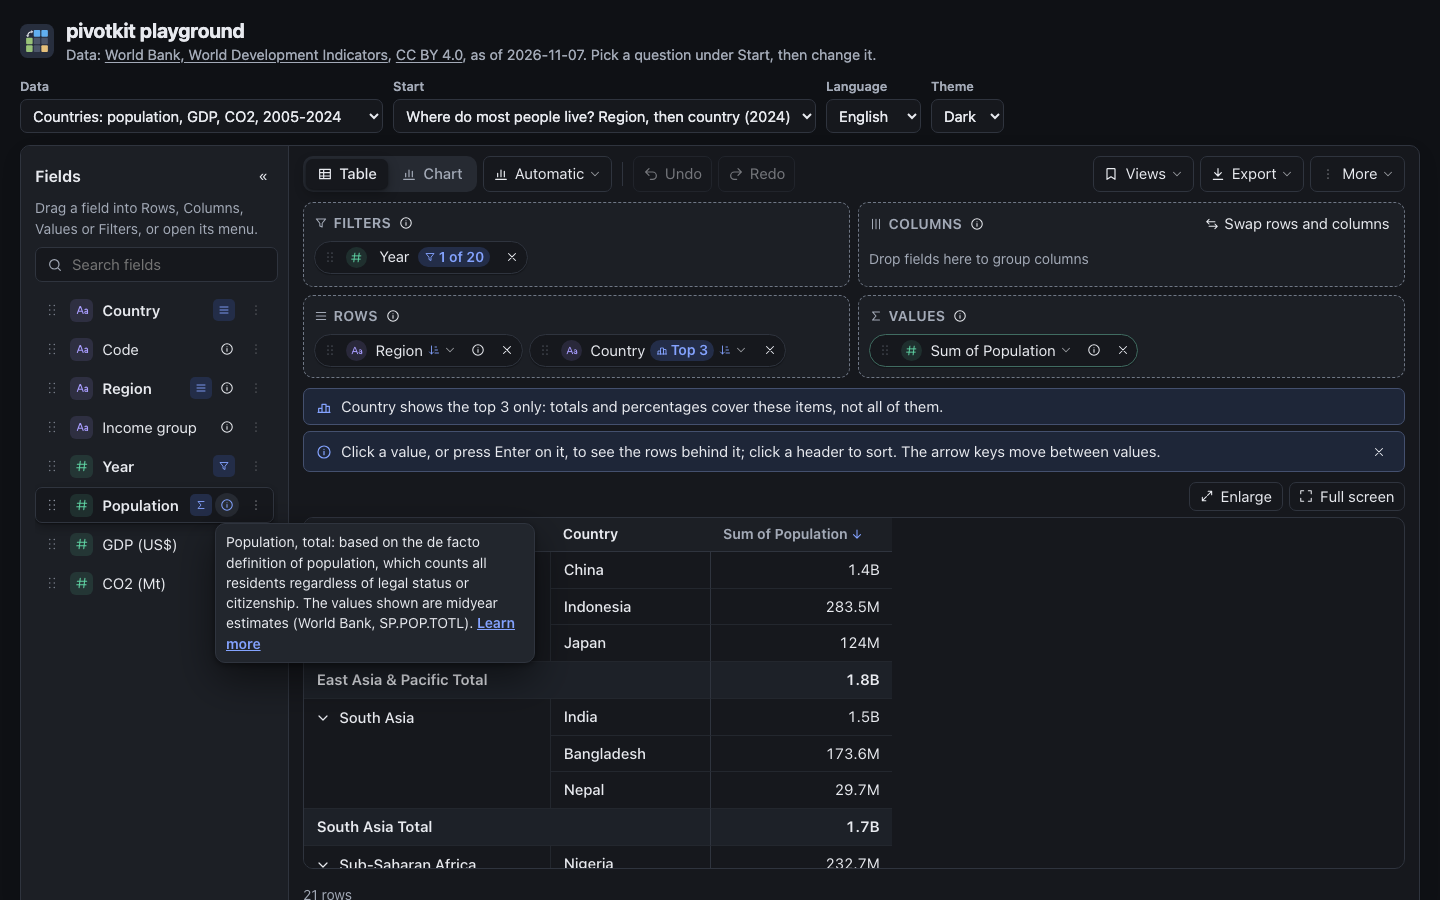
When the application describes its fields, an i stands next to such a field in the list and on its chips. Point at it, or move the focus to it with Tab, and the description appears; click or tap it to keep it open, with Learn more when there is a page about the field. Escape closes it.
- On a phone a chip has no i; the chip's menu has it at its top, next to the field's name, and the field's headers in the table and in the drill-down carry the same text.
- The field search finds a field by its name, by the name the application gives it and by words of its description. Its × and Escape empty the search.
- The application may give a field a clearer name than the data's; the report uses that name everywhere, also in the exported files.
For developers
Labels, descriptions and links come from fieldDefaults or a JSON Schema or OpenAPI document:
Field descriptions and names.
Chips
Every field in a zone is a chip. A chip shows what is set on it: "3 of 4" for a filter, "Top 5", a value condition ("Sum of Revenue > 1,000"; a long one ends in "…"), the sort. Screen readers hear the same.
| To | Do |
|---|---|
| Reorder a chip or move it to another zone | Drag it. |
| Remove it | Drag it back to the field list, or press its x. A note in the status line offers Undo ("Region removed"); the focus goes to the neighbouring chip, or to the zone. |
| Change everything else | Open its menu (the arrow). |
A field that leaves the report (its x, Remove field, or dragged to the field list) takes its filters and its sort with it.
The menu of a row or column field
Sections that hold a setting say it first, in one line, with Change and Remove; one with nothing set shows a single item whose form opens on a click. When the field has a description, the menu's first row is its name with an i.
| Section | What it offers |
|---|---|
| Sort | By label; "Largest Sum of Revenue first" and "Smallest Sum of Revenue first" for each value that gives a number, so with two values you choose which one orders the items; "Custom order" and "Custom order, reversed" when the field has one, such as the seasons in the order of the year (sorting). |
| Filters | What the values and the text condition keep, with Remove; the value condition in a line of its own with Change and Remove, else Value condition…; Choose values… (filters). |
| Top items | "Top 10 by Sum of Revenue · Change · Remove", or Show top items…: top or bottom N by a value you choose (top N). |
| Date grouping (dates) | Along the time line: year, quarter, month, week, day; or across years: quarter, month, week of the year, weekday, hour (dates). |
| Number ranges (numbers) | "Ranges of 0.5 from 4.5 · Change · Remove", or Group into ranges…: their size and where they start (ranges). |
| Move | To another zone. |
| Remove field | Always at the foot. |
The menu of a value is on Values and formats.
The table
- The header and the row labels stay in place (sticky) while you scroll.
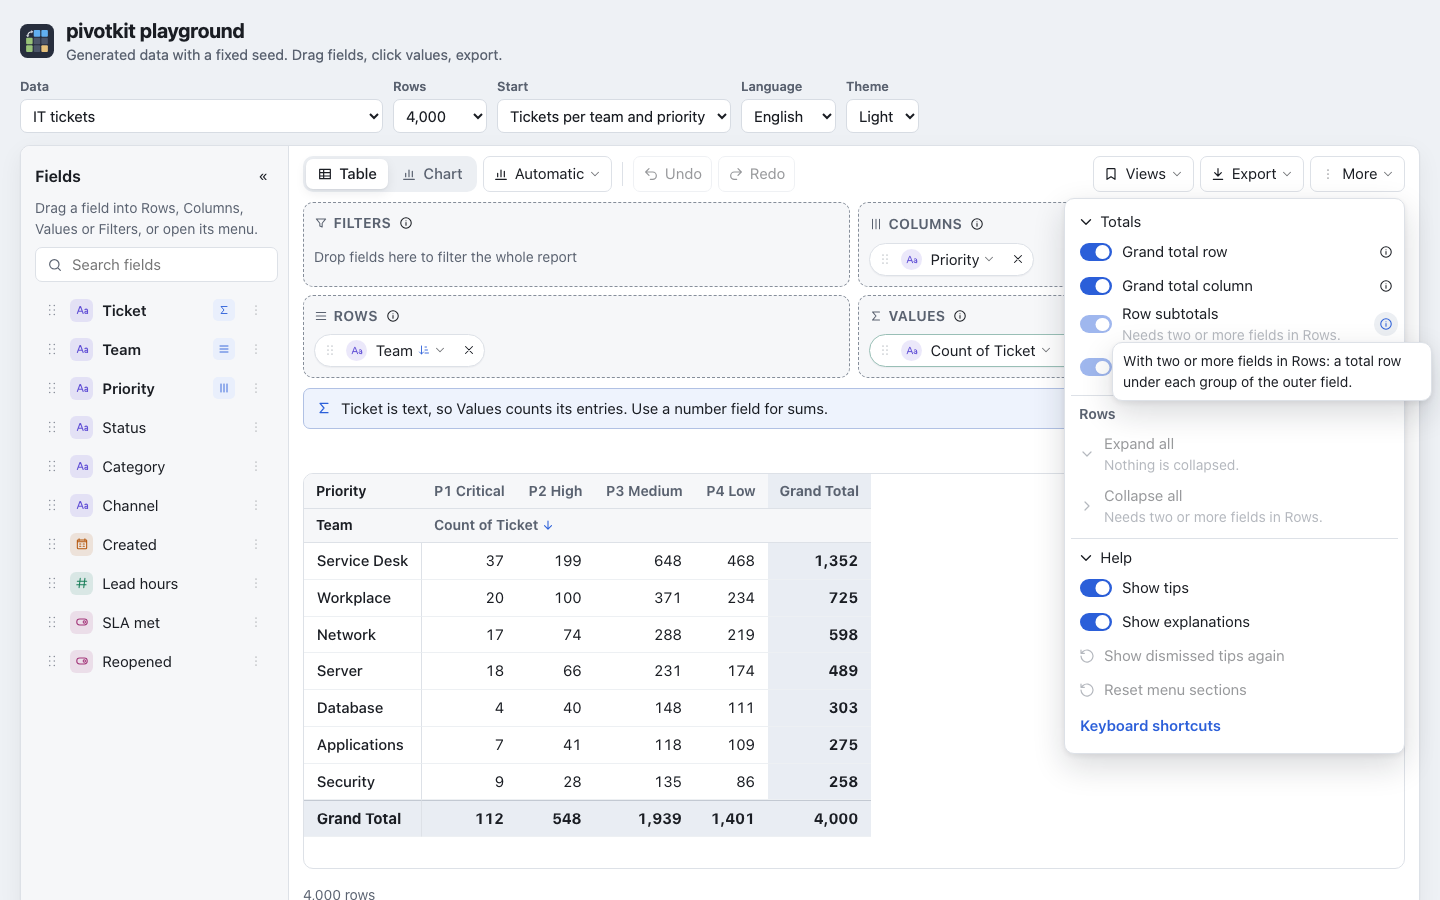
- Groups expand and collapse with the arrow next to them. Options has Expand all and Collapse all for the groups of Rows (groups of Columns open and close with their arrows only). Each is offered only when it changes something; otherwise a line under it says why ("Nothing is collapsed.", "Needs two or more fields in Rows.", "Every group is collapsed already."), and after a click the status line says what it did ("5 groups collapsed").
- Swap rows and columns (above Columns) swaps the fields, which groups are collapsed, and the direction of calculations: "% of row total" becomes "% of column total", a running total along Rows runs along Columns. Where the zone is narrow the button drops its text.
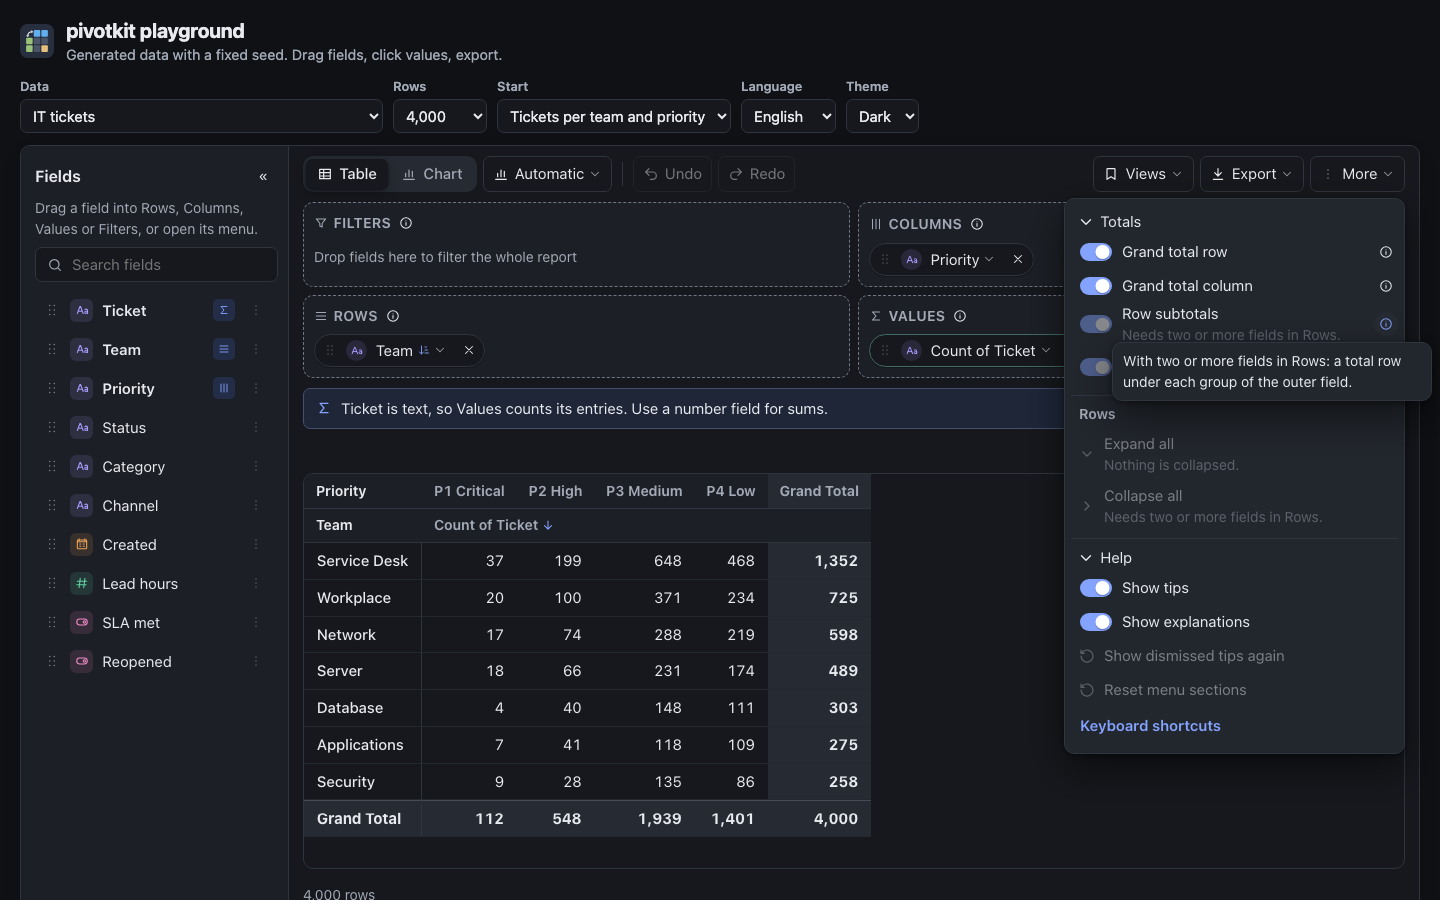
- Subtotals and grand totals are switched on and off in Options, each with an i that says what it does. A switch that would change nothing in this layout is greyed out with the reason under it: the grand total row needs a field in Rows, the grand total column a field in Columns, row subtotals two or more fields in Rows, column subtotals two or more fields in Columns.
- Field names and value names in the header can be dragged into a zone. A click on a value's name or on a field's name in Rows sorts the rows (sort with a click on a header).
- With one value, its name stands once over all of its columns.
- The table is as wide as its columns and scrolls sideways when it is wider than the report.
- Long row labels wrap between words, so on a phone numbers stay in view next to them. On a phone a row label keeps at least 5.5em, so a common word is never cut; a longer word breaks at a hyphen of its own, and a word longer than the column breaks anywhere as a last resort.
- From 300 rows on the table draws only the rows in view (it stays fast), and a row label is cut to one line; the status line under the table shows the whole label of the row the focus is on, or of a label you tap.
For developers
How the layout follows the report's width, and the least heights, are in the pivotkit-react reference.