Export and copy
Export in the toolbar downloads the table as an Excel workbook or a CSV file, the chart as a picture, or copies the table so you can paste it into a spreadsheet. The Excel file keeps every number with all its decimals and the formats; the CSV and the copy hold the numbers as the table shows them.
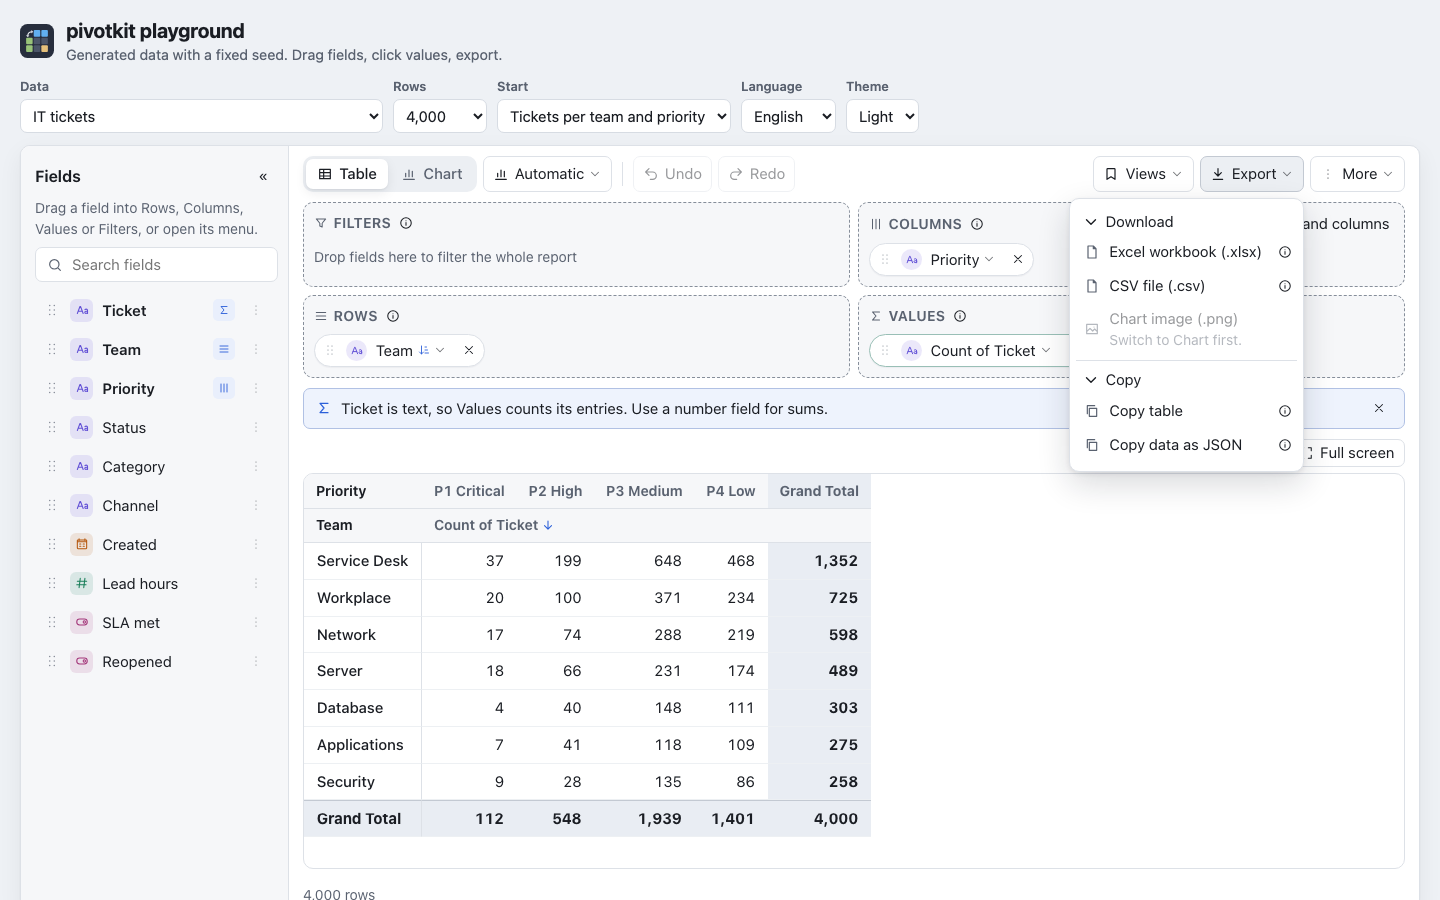
| Entry | Gives | Best for |
|---|---|---|
| Excel workbook (.xlsx) | The table with every number and all its decimals, the number formats, the merged headers, the bold totals and the highlighting. | Calculating on in Excel. |
| CSV file (.csv) | The table as text: percentages and "show as" calculations as the table shows them, other numbers with all their decimals. | Other programs. |
| Chart image (.png) | The chart as drawn. Greyed out while the table is shown ("Switch to Chart first."). | A slide or a message. |
| Copy table | The table as it is shown, tab-separated. | Pasting into Excel, Numbers or Google Sheets. |
| Copy data as JSON | The table's data for a program. | A developer. |
While no field is placed there is nothing to export: every entry is greyed out with "Add a field first." under it, and nothing is downloaded or copied.
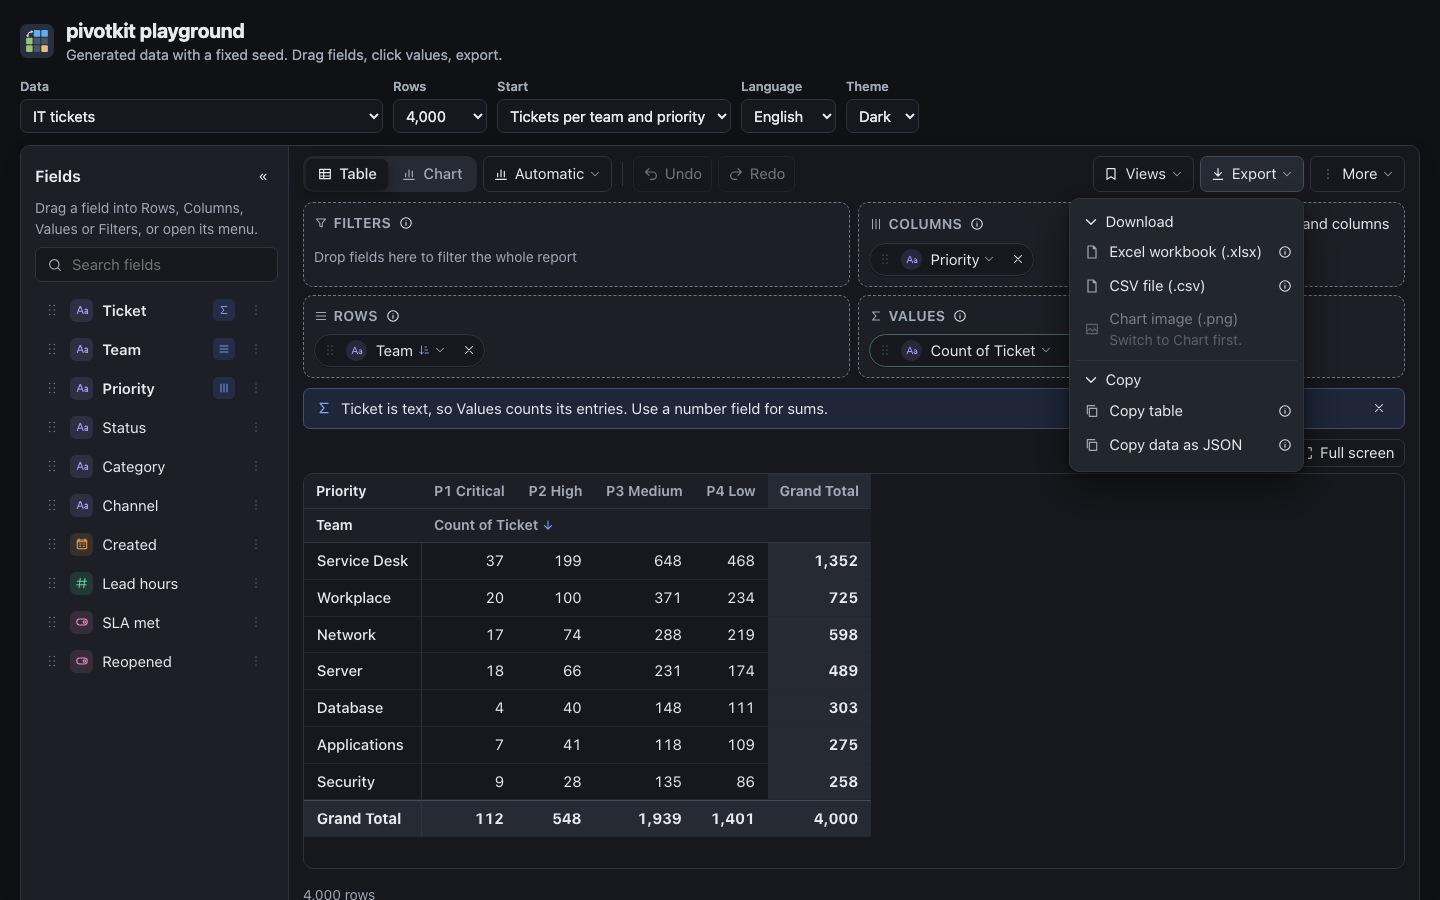
The menu has two sections, Download and Copy, in that order also in the drill-down's Export menu; they fold like the other menus' sections and the report remembers them. An i next to Excel, CSV, Copy table and Copy data as JSON says what each holds.
What each one holds
Excel workbook
Every number with all its decimals, the number formats, the merged headers, the bold totals and the highlighting (colour scales and data bars as Excel's own conditional formats, so they stay live). The sheet has the file's name, made valid for Excel: at most 31 characters. Where Excel cannot follow a format: bytes and durations are written as plain numbers, compact numbers in languages that group by ten thousand (Japanese) as general numbers, and dates before 1900 as text. Number labels (a year on rows) stay numbers.
CSV file
UTF-8 with a byte order mark, so Excel reads accents and umlauts right. The separator and the decimal mark follow the report's language. Percentages and "show values as" calculations are written as the table shows them ("-2.6%"), which spreadsheets read back as the fraction; other numbers keep all their decimals (15 significant digits). A row label is repeated on every row it spans.
Chart image
The chart as drawn, at twice the screen's resolution, on the report's background colour: with its title, legend, value labels and group labels.
Copy table
The table as it is shown: headers, labels and totals, every number as the table writes it ("1,234.5", "35.7%"), tab-separated, a row label repeated on every row it spans. Pasted into Excel, Numbers or Google Sheets it lands in columns; a spreadsheet in the same language reads the numbers back as numbers. After the copy a note says what it gave: "Table copied: tab-separated, pastes into Excel or Google Sheets as columns".
Copy data as JSON
The table's data for a program: the header texts above each value column, and per row its labels and its values with all their decimals, a percentage of "Show as" as the fraction (0.25 for 25%), a collapsed group marked as such. It is not the view: Views, Copy view as JSON copies how the report is built, not its numbers (sharing).
File names
The files are named after the application's report name, "pivot" when it gives none: pivot.xlsx,
pivot.csv, pivot.png. A downloaded view is <name>.pivotkit.json, after the view's or the
data's name (views). The rows behind a number are named after the cell
(drill-down).
Safe to open
A label a spreadsheet would run as a formula (it starts with =, @, or + or - and is no number)
gets a leading ', in the CSV and in the copies. The Excel file writes text as text, never as a
formula (security).
When copying is not allowed
Where the page does not allow copying (an address without https, a frame without the permission) a note says so: "This page does not allow copying. Download a file instead."
For developers
fileName names the files; every file and every copy passes onExport first (xlsx, csv,
png, json for a downloaded view file, copy-table, copy-json), so the host can keep it
(React props). The shape of Copy data as JSON is
pivotkit-core's toJson; how formats reach Excel and CSV is in
Values.