Use a report
These pages are for the people who build reports with pivotkit in an application. You need no programming: you drag fields, pick from menus and read the result. Everything here works the same in every application that uses pivotkit; the live demo is a good place to follow along.
Where to start
- Quick start: your first report in six steps, with a picture of each.
- Learn with real data: questions to answer on real public data (weather, countries, earthquakes, Nobel laureates, software end of life), each with "Read it" and "Try this".
- Then look up what you need below.
One page per task
| I want to... | Page |
|---|---|
| Put fields into rows, columns and values, rearrange them, read the table | Fields, zones and the table |
| Sum, count or average, show a share or a running total, format numbers, group dates | Values and formats |
| Leave values out, keep the top 10, sort | Filters, top N and sorting |
| Show the report as a chart, change labels, legend and title | Charts |
| See the rows behind a number, copy or download them | The rows behind a number |
| Undo, save a view, pick a shared one, share a link or a file, load one | Views, saving and sharing |
| Download Excel, CSV or a chart image, copy the table into a spreadsheet | Export and copy |
| Use the report with a keyboard or a screen reader | Keyboard and screen readers |
| Give the result more room, use the report on a phone, find my way in long menus, tips | Small screens, menus and tips |
| Know why a button is greyed out, what a message means, why the report shows nothing | Behaviour reference |
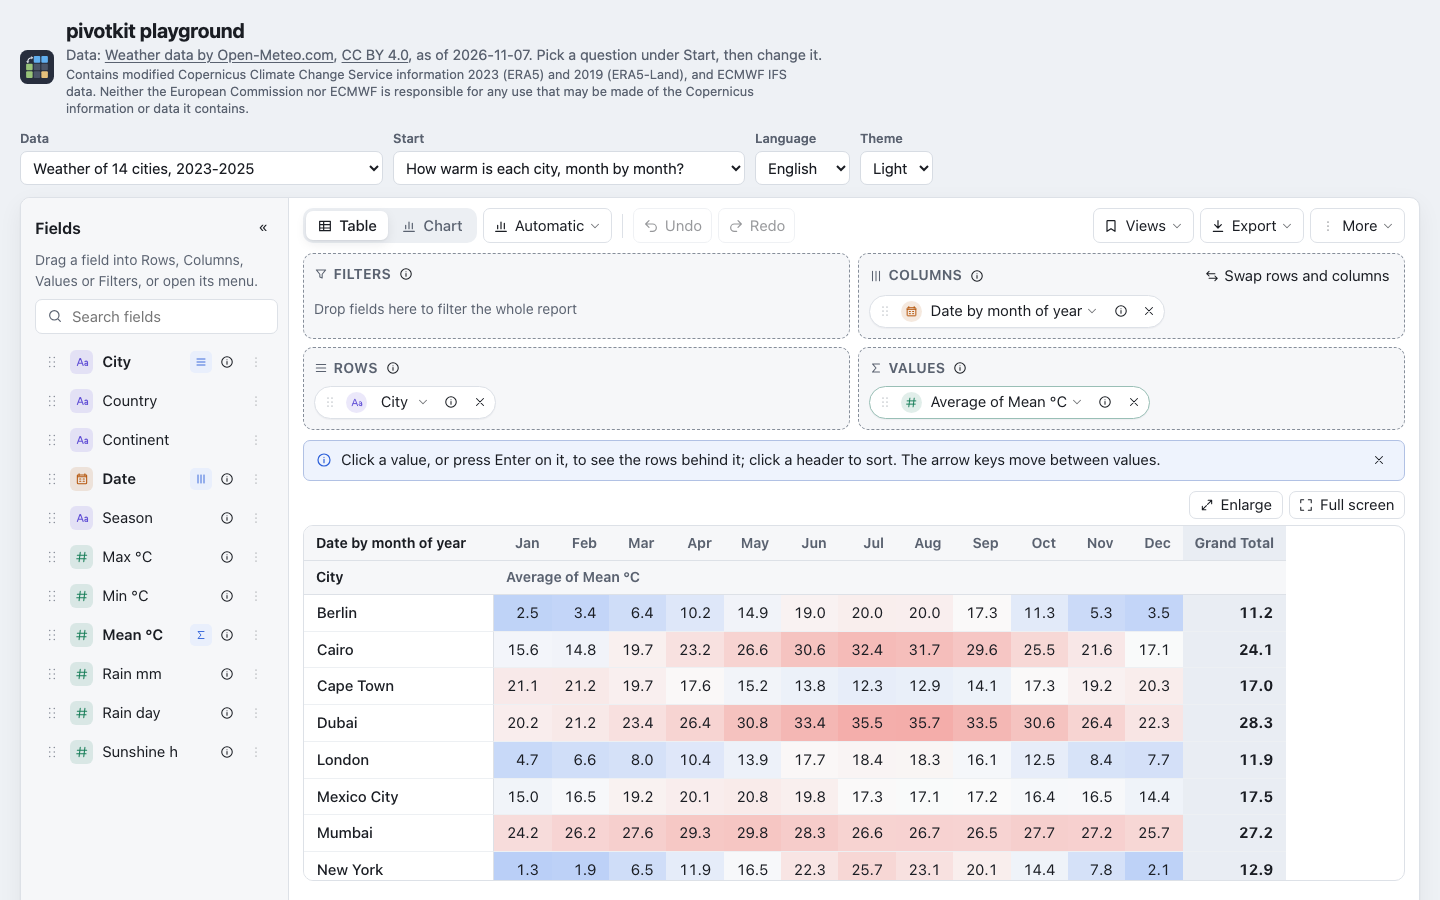
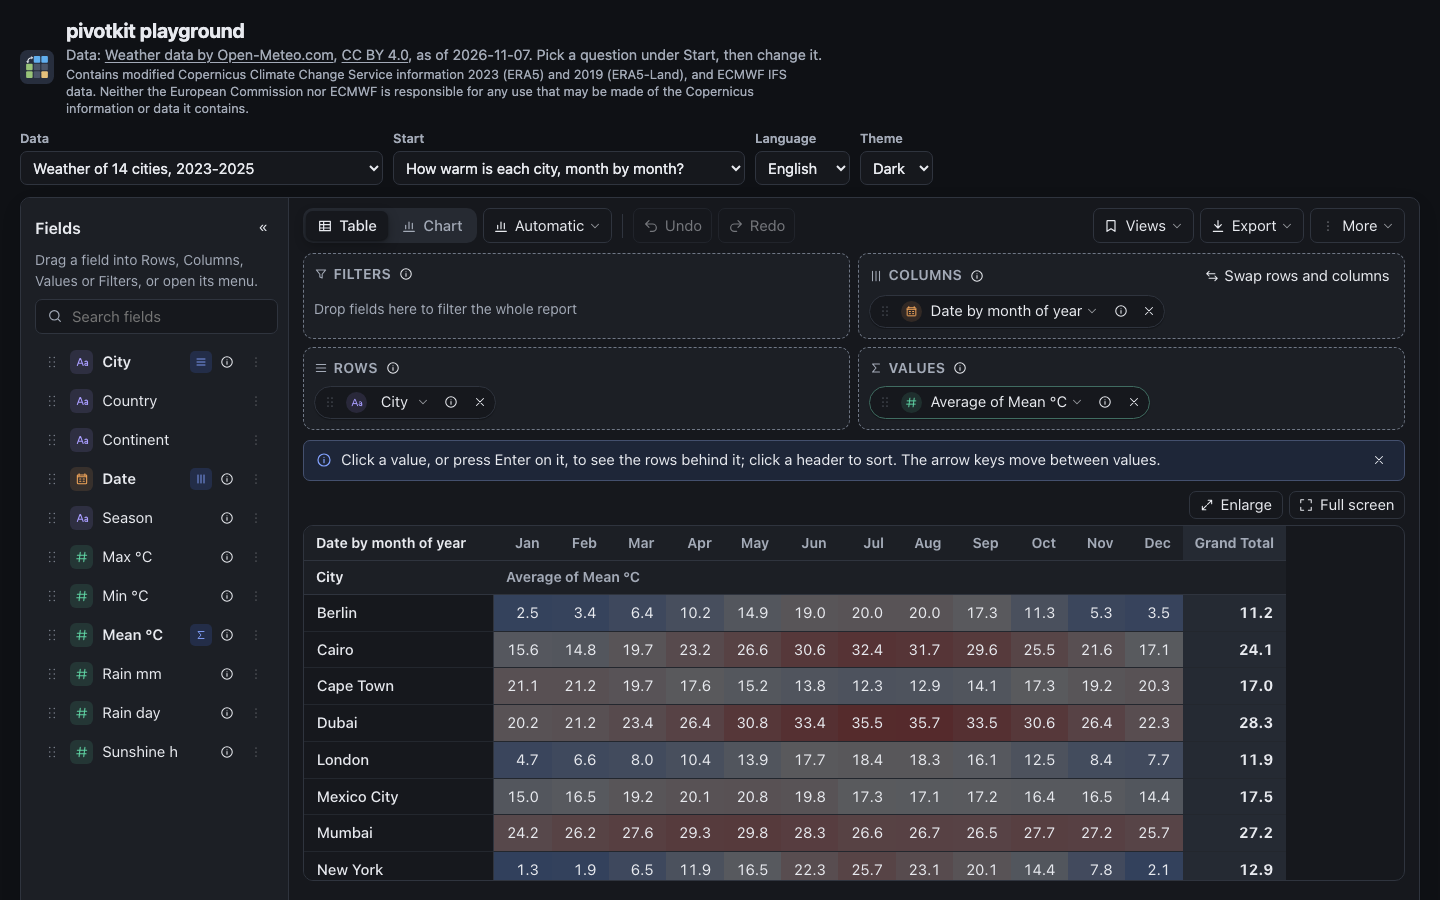
Weather data by Open-Meteo.com (CC BY 4.0); contains modified Copernicus Climate Change Service information (attribution).
For developers
These pages hold for the React component and the web component alike. Putting the report into your application is described under Embed pivotkit; every setting named on these pages in a "For developers" box is in the pivotkit-react reference and the element reference.